

1. Introduction
Pulp sheet is a kind of thin-layer fibrous material that made from plant fibers through chemical, mechanical, or combined treatment. It could be used to make paper, paperboard and paper-based functional materials. In China, large amount of pulp was consumed for producing paper or paperboards each year. According to statistics, China’s paper and paperboard production has reached 104.35 million tons in 2018.1) In order to facilitate pulp transportation for further paper production, the wet pulp commonly need to be dried during the production process.
The thin-layer drying is a coupling process of mass and heat transfer. The well-established dynamic model was often used to describe drying process due to the complexity. In recent years, many researchers have used drying kinetic models to describe the drying process of pulp or paper products. For example, Liu et al.2) observed the effects of temperature, air velocity and thickness on the drying characteristics of molded pulp. Zhang3) observed the drying characteristics of pulp mold packaging product. It included the effects of air velocity and temperature on the pulp drying rate and drying efficiency. Motta Lima et al.4) observed the difference between natural convection and forced convection drying, and successfully described the generalized drying rate curve by Hodges model. These researches provided theoretical references for exploring the drying characteristics of pulp sheet. However, the applicability of drying kinetic model lacked the understanding and interpretation.
The drying kinetic model expresses the change of moisture content over time during the drying process of pulp sheet. It could be divided into theoretical models, semi-theoretical models and empirical models.5) Empirical models are derived from experimental data. Theoretical models and semi-theoretical models are based on the series solution of Fick’s second law of diffusion. Therefore, studying the applicability of the series solution of Fick’s second law of diffusion is the basis for understanding the drying kinetics models in thin-layer drying of pulp sheet. Ghazanfari et al.6) used one-to five-term series solutions of Fick’s second law of diffusion to model the thin-layer drying of flax fibers and estimated the effective moisture diffusion coefficient at different drying conditions. They found these models underestimated the drying process during the initial stages of drying and overestimated this process during the final stages. However, the fitting accuracy of the models was low from the fitting curve of the flax fibers drying process.
In this paper, we studied the effect of hot air temperature in the drying process of pulp sheet firstly. And then, the drying kinetics of pulp sheet was analyzed by using the one-, to five-term solutions of Fick’s second law of diffusion. At the same time, the modified models based on Fick’s second law of diffusion (one-term modified model, two-term modified model, three-term modified model) were proposed to simulate the drying process accurately.
2. Materials and Methods
2.1 Experimental materials
The experimental material was unbleached Kraft pulp sheet imported from Canada, with original size is 850 mm×800 mm×1 mm. The pulp sheet was cut into 80 mm×80 mm×1 mm, and the mass was about 5 g. After the water penetration was fully uniform, samples had the initial moisture content of about 70%.
2.2 Experimental equipment and methods
The drying experimental equipment is shown in Fig. 1. The air entered the experimental equipment through 3 (Inlet valve), and the power was supplied by 4 (Blower). The air velocity was controlled by 5 (Control valve). After heated by 8 (Electrical heater), it was sent to 9 (Drying chamber: section size ≥140×200 mm). The velocity and temperature of the air were measured by 6 (Orifice flowmeter) and 7 (Inlet thermometer). The temperature of the drying chamber was measured by 10 (Wet-bulb thermometer) and 11 (Dry-bulb thermometer). The weight of pulp sheet was weighed by electronic balance. A part of the dried exhaust gas was discharged through 1 (Exhaust valve), and the other was mixed with fresh air through 2 (Circulating valve) in order to recycle the exhaust gas.
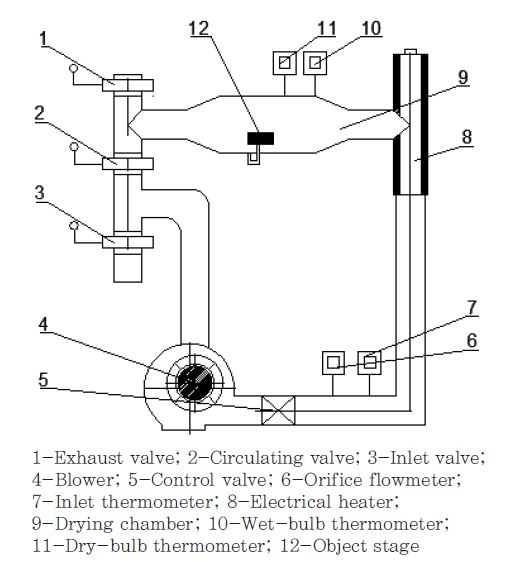
Before starting the experiment, set the hot air temperature to 80℃ and the air velocity to 2.48 m/s. After the system was stably operated for 5 minutes, the pulp sheet was placed in 12 (Object stage) parallel to start the drying experiment. For the first 10 minutes, took out the pulp sheet quickly and put it into electronic balance to record the weight of the pulp sheet, and then recorded every 60 seconds until the weight of dried pulp sheet remained unchanged substantially. In order to research the effect of temperature in drying process, we kept air velocity constant and set hot air temperature was to 90°C and 100°C sequently. Repeated the above experimental steps to obtain experimental data in drying process of pulp sheet.
3. Mathematical Modeling
During the pulp sheet drying process, we used the drying rate to indicate the change of moisture content in a certain time interval, which could be derived as follows:
Where t1 and t2 are the drying time (min),Xt1 and Xt2 are the moisture content of the pulp sheet at time t1 and t2 (g water/g fiber).
Assuming the wet pulp sheet is uniform and isotropic. The flows resistance of the moisture is uniform in the material. The effective moisture diffusion coefficient is independent of the local moisture content. The volume shrinkage of pulp sheet is ignored. Fick’s second law could be derived as follows:7)
Where MR is moisture ratio of the pulp sheet, t is drying time (s), x is the pulp sheet’s thickness (m), and D is the effective moisture diffusion coefficient (m2/s).
In most situations, the pulp sheet is assumed as an infinite slab. At the same time, assumed internal moisture movement is the main resistance and has a uniform initial moisture content of pulp sheet. Crank8) gave the mathematical solution of Eq. 2 and expressed as Eq. 3 firstly.
Where δ is the thickness of the pulp sheet (m), D is the effective moisture diffusion coefficient (m2/s), t is the drying time (s).
In order to simplify Eq. 3 form, taking the first few terms of the Equation as approximate solutions in general. Taking A=8/π2 and B=π2/δ2, then one-, two-, and three-term forms of Eq. 3 could be derived as follows:
The four- and five-term structure are complex and similar to above model, so not shown here.
Henderson et al.9) and Erbay et al.10) made a parameter correction of the Eqs. 4-6 in order to describe the drying process of wet material accurately, which using the same form and could be derived as follows:
Eqs. 7-9 are also called modified one-term model, modified two-term model, modified three-term model.
Fitted model parameters with SPSS 21 software and plotted curve images with Origin 11 software. The coefficient of determination (R2), root mean square error (RMSE) between the experimental and predicted values were used to evaluate goodness of fit of the tested models. The higher values of the coefficient of determination (R2), and the lower values of the root mean square error (RMSE) indicated a high degree of fit. These parameters could be calculated by Eqs. 10-11:
Where MRexp is the experimental moisture ratio of pulp sheet, MRpre is the predicted moisture ratio of pulp sheet, N is the number of experimental measurements.
4. Results and Discussion
4.1 Pulp sheet drying characteristics
Fig. 2 was the curve of moisture ratio (MR) of the pulp sheet according to drying time (t) at different drying air temperature levels. It could be seen with the temperature increased from 80°C to 100°C, the drying time decreased from 26 min to 20 min. This was because when the temperature of pulp sheet increased, the temperature gradient between the interior and surfaces increased, which increased the rate of evaporation of surface moisture and outward diffusion of internal moisture. It led to higher drying rates and shorter drying times of pulp sheet.
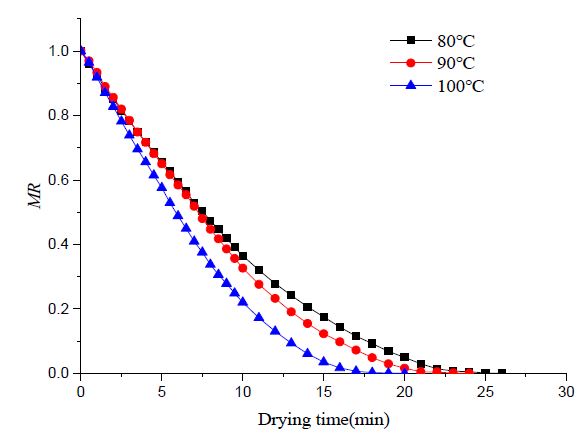
Fig. 2.
Moisture ratio of the pulp sheet according to drying time at different drying air temperature.
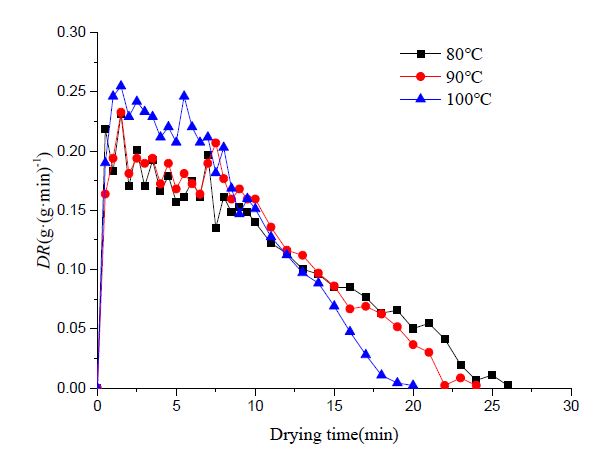
Fig. 3 was the curve of drying rate (DR) of the pulp sheet according to drying time (t) at different drying air temperature levels. It could be seen the drying of pulp sheet could be divided into three periods: the speed increasing drying period, the constant speed drying period, and the falling rate drying period. There was a significant different in the constant speed drying period. It indicated that the temperature mainly affected the constant speed drying period. When the temperature increased from 80 to 100°C, the corresponding time decreased from 7 min to 4 min and drying rate increased from 0.18 to 0.25 g/(g·min) in this period. This was because when the temperature of pulp sheet increased, the rate of evaporation of surface moisture increased and the time to reach critical moisture point decreased. This led to rate balance between the water removal from the surface of pulp sheet and the heat transfer to the surface was more broken easily.
4.2 The series solution of Fick’s second law of diffusion
We used Eqs. 4-6 to draw Table 1 and Fig. 4, and used Eqs. 10-11 to determine the accuracy of the simulated values in Table 1. The drying time and corresponding moisture ratio data of pulp sheet was recorded. The effective moisture diffusion coefficient (D) was calculated by using one-, to five-term forms of the Fick’s second law of diffusion. Table 1 summarized the results of fitting the five models to the drying data at different temperature (80, 90, and 100℃). It could be seen the range of the effective moisture diffusion coefficient was between 1.368×10⁻¹⁰ m2/s to 1.836×10⁻¹⁰ m2/s. On the one hand, the effective moisture diffusion coefficient increased with the drying temperature increased at same number of series term. On the other hand, the effective moisture diffusion coefficient decreased with the number of series terms in the models increased at same temperature. Meanwhile, the absolute coefficient (R2) increased, and the root mean square error (RMSE) decreased, indicated that the model fit was improved. However, when the number of series solution of Fick’s second law of diffusion was greater than three term, the values of D, R2 and RMSE tended to stabilize. It could be seen that using three-term model to indicate the analytical solution of Fick’s second law was accurate enough in thin-layer drying of pulp sheet.
Table 1.
Results of fitting the five models to the drying data at different temperature
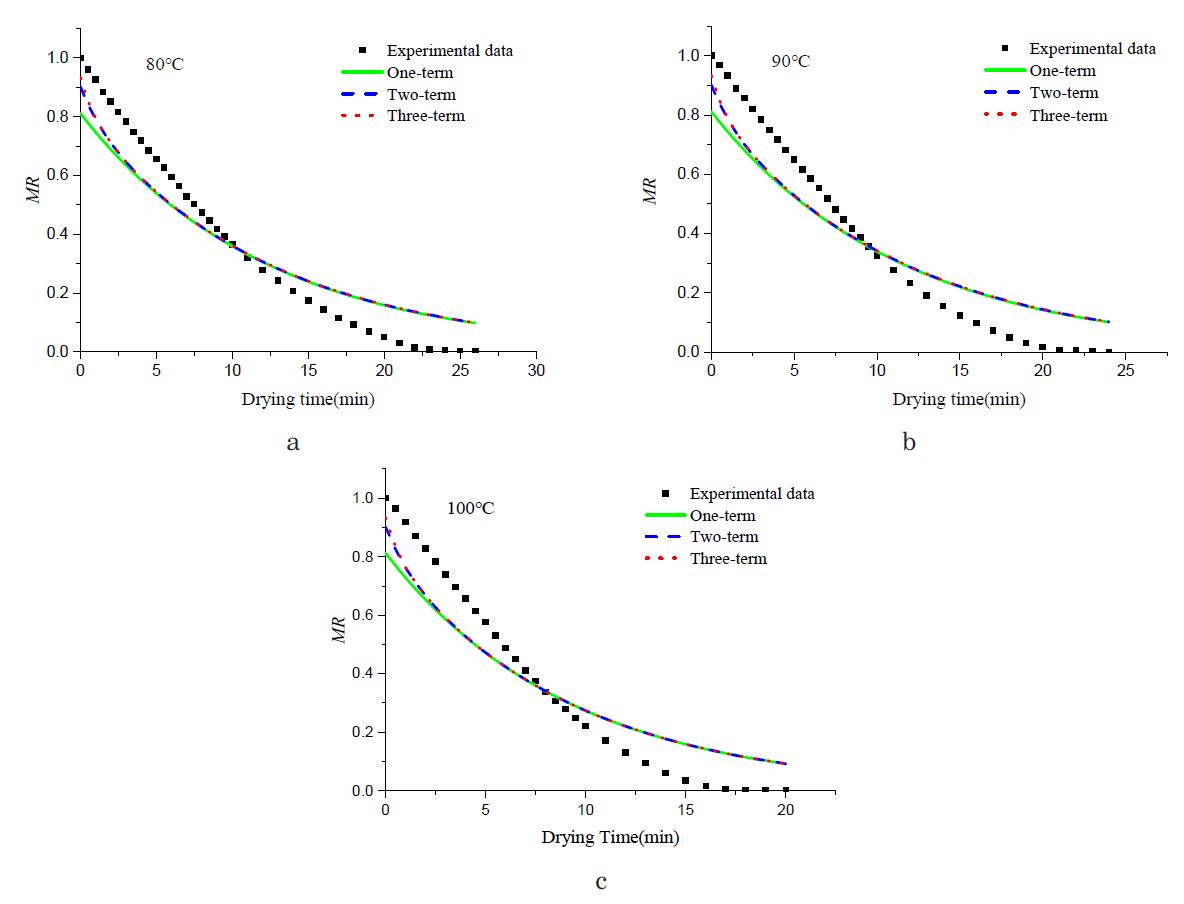
The moisture contents calculated from the drying data was plotted versus drying time at different drying conditions. The graphs and their corresponding fitted one- to three-term models were presented in Fig. 4. In general, the three curves fitted were basically consistent with the trend of the experimental data. There were differences between one-term to three terms models curves in the early stage of drying, which was about 1/5 during the entire drying process of pulp sheet. Meanwhile, the curves of fit gradually approached the experimental data with the number of series terms in the models increased in this period. As the drying progressed, the three curves of fit followed exactly the same path. We found that the difference between the two- and three-term models’ curves was very close comparing the one- and two-term models curves. It showed that as the number of terms increased, the error of the solution of Fick’s second diffusion law gradually decreased and approaches zero. All the above analyses indicated that using the three-term solution to indicate the analytical solution of Fick’s second law was accurate enough in thin-layer drying of pulp sheet. Comparison of experiment curve and model fitting curve, we could see that the three curves of fit underestimated the experimental data during initial stage and overestimated the experimental data during late stage of the pulp sheet drying process. Therefore, the fitting accuracy of Fick’s diffusion model should be improved to describe the drying kinetics of pulp sheet.
4.3 Modified multi-term model of Fick’s second law of diffusion
Considering that the series of solutions of Fick’s second law was only a theoretical solution, the modified multi-term models (modified one-term model, modified two-term model, modified three-term model) were used to describe the drying process of pulp sheet to improve accuracy of model. Table 2 summarized the results of fitting the modified multi-term models to the drying data at different temperature. The models were evaluated based on R2 and RMSE. We used Eqs. 7-9 to draw Table 2 and Fig. 5, and used Eqs. 10-11 to determine the accuracy of the simulated values in Table 2. In all the fitting results, the values of R2 was between 0.975 to 0.998, RMSE was between 0.0150 to 0.0513. Moreover, the modified three-term model was the best descriptive model compared to the other two models at same temperature.
Table 2.
Statistical results obtained from modified one- to three-term model at different temperature
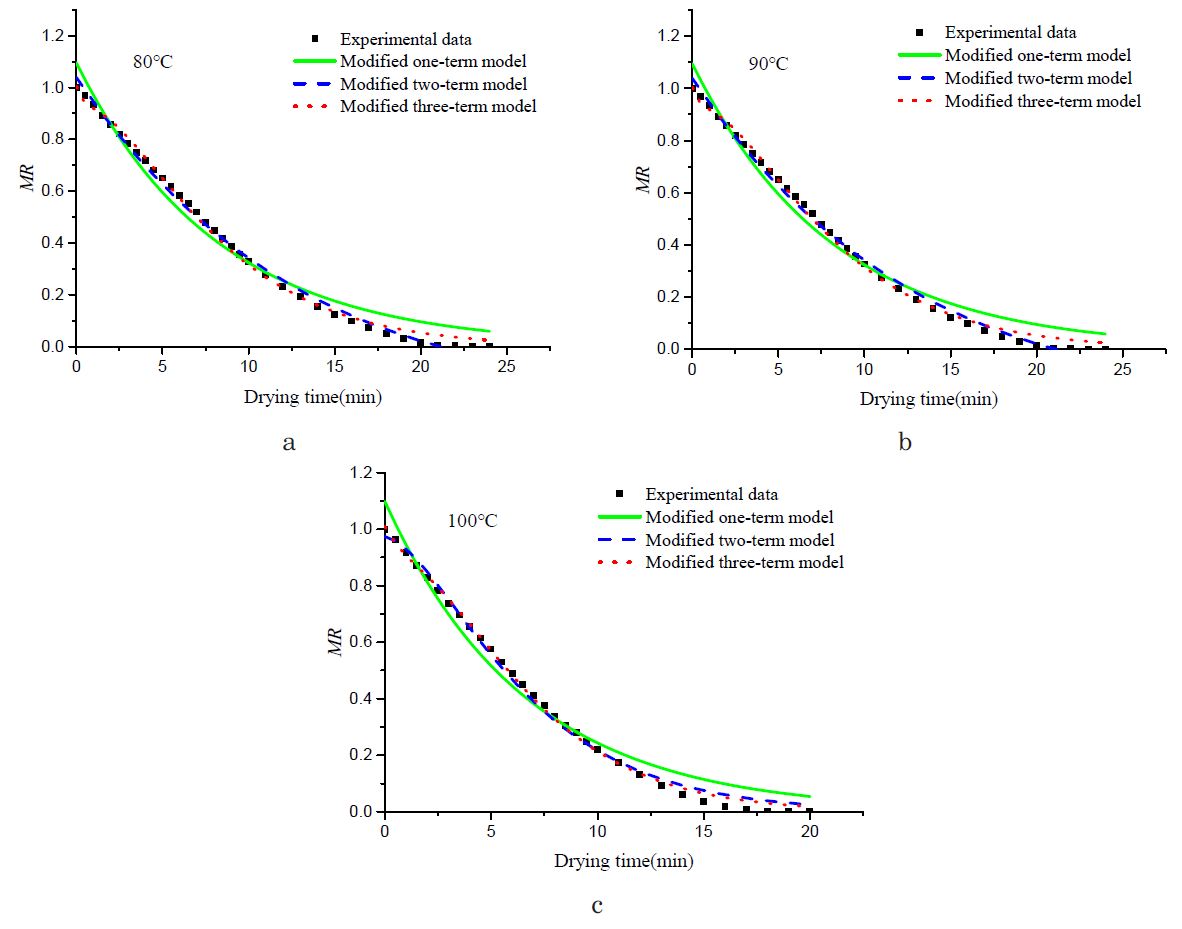
In order to observe the difference between the modified multi-term model and the experimental data detailly. We plotted the change of the moisture content with drying time using modified multi-term model and the experimental data, as shown in Fig.5. It could be seen that modified oneterm model, modified two-term model, and modified three-term model were similar to the experimental curve and only slightly different in the late drying stage. We found that modified two-term model was closer to experimental data at 80 and 90℃, while modified three-term model was closer to experimental data at 100℃ in this period. However, the modified three-term model was closer to experimental data during the entire drying process. This indicated that the modified three-term of the series solution of the Fick’s second diffusion model could be used to describe the hot-air drying process of pulp sheet and exhibited a high fitting precision.
5. Conclusions
The thin-layer drying of pulp sheet was modeled using one- to five-term series solutions of Fick’s second law of diffusion and the diffusion coefficient at different drying conditions were estimated. We found that using three-term model could indicate the analytical solution of Fick’s second law and more than a three-term model will not markedly improve the accuracy in thin-layer drying of pulp sheet by comparing the values of R2 and RMSE. The series solution of Fick’s second law of diffusion underestimated the early stage and overestimated the late stage in the drying process of pulp sheet. The modeling data of modified multi-term model (modified one-term model, modified two-term model, modified three-term model) was agreed with the experiment data better than the series solution models based on Fick’s second law of diffusion. With the number of terms increased, the accuracy of modified multi-term model fitting improved. Moreover, the values of R2 were greater than 0.996 and RMSE were less than 0.02 of modified three-term model, respectively, for all drying air temperatures. Thus, the modified three-term model based on Fick’s second diffusion could be used to model the drying kinetics of pulp sheet during hot-air drying process.
