

1. Introduction
2. Materials and Methods
2.1 Sugar hydrolysate of sweet potato waste
2.2 Gluconacetobacter xylinus
2.3 Fermentation conditions
2.4 Post-production of bacterial nanocellulose
2.5 Proximate analysis
2.6 Sugar analysis (DNS & HPLC)
2.7 Microbial growth quantification
2.8 Statistical analysis
2.9 X-ray diffraction
2.10 Scanning electron microscopy
3. Results and Discussion
3.1 Proximate analysis
3.2 Microbial growth kinetics
3.3 Sugar consumption analysis
3.4 Bacterial nanocellulose production
3.5 Optimization of fermentation condition (Box-Behnken Design)
3.6 Characterization of bacterial nanocellulose
4. Conclusions
1. Introduction
Sweet potato (Ipomoea batatas) is a tuberous crop of considerable importance in tropical and subtropical agriculture, particularly in countries like Indonesia, where it plays a vital role in food security, rural livelihoods, and cultural traditions. With its creeping stems and characteristic purple, trumpet-shaped flowers, the plant produces starchy tubers that serve as a major source of carbohydrates. Its resilience under marginal growing conditions and low input requirements make sweet potato a reliable and sustainable crop for smallholder farmers. Beyond its agricultural value, sweet potato also offers a diversity of varieties with specific sensory and nutritional attributes. For example, the Cilembu variety is well-known for its honey-like sweetness after roasting, making it a sought-after delicacy. Meanwhile, purple sweet potatoes are valued for their anthocyanin-rich content—natural antioxidants linked to health benefits—whereas yellow-fleshed varieties are commonly incorporated into daily meals across regions.
Indonesia has seen a steady increase in sweet potato production, driven by both domestic demand and government support for local food diversification. Data from Statistics Indonesia [1] indicate that the country’s sweet potato production reached 2.3 million tons in 2015, and the trajectory continues to rise. While this growth signals a positive trend in agricultural productivity, it also presents a lesser-known issue—post-harvest loss and waste. A considerable fraction of sweet potato harvests never reaches consumers due to damage during harvesting, microbial spoilage, or failure to meet aesthetic standards. According to Zahra et al. [2], approximately 9.4% of the harvested sweet potatoes are discarded, translating into tons of organic waste with limited or no economic return. However, within this challenge lies an opportunity: the valorization of sweet potato waste into high-value bioproducts that contribute to sustainable development and circular economy practices. Particularly, waste from rotting or rejected Cilembu sweet potatoes, which still retains high levels of starch despite their inedibility, holds untapped potential as a renewable carbon source. One promising pathway is its conversion into bacterial nanocellulose (BNC), a nano-structured biopolymer produced through microbial fermentation, most notably by acetic acid bacteria such as Gluconacetobacter xylinus.
BNC is attracting increasing interest across scientific and industrial domains due to its exceptional mechanical strength, ultrafine nanofibrillar network, high water-holding capacity, crystallinity, and biocompatibility. Unlike plant-derived cellulose, BNC is free from lignin and hemicellulose, and its biosynthetic process allows for precise control over material structure. These features make it highly suitable for a wide range of applications, including medical dressings, tissue engineering scaffolds, cosmetic formulations, food packaging films, and even flexible electronic components. Nevertheless, the cost of BNC production remains a significant barrier to large-scale application. Therefore, identifying low-cost, readily available feedstocks is crucial to improving the economic feasibility of BNC-based materials.
In this study, we propose a fermentation-based bioconversion of rotten Cilembu sweet potato waste into BNC, leveraging its rich starch content as a fermentable carbon source for G. xylinus. By using food-grade rejected tubers, we provide a value-added outlet for agricultural waste streams while supporting waste reduction strategies. To optimize the bioproduction process, Response Surface Methodology (RSM) was applied to model and evaluate the effects of key process variables, including PH, incubation temperature, and substrate concentration. The specific objectives of this study are to determines the influence of these parameters on BNC yield and to identify the optimal fermentation conditions for efficient nanocellulose production from Cilembu sweet potato waste.
2. Materials and Methods
2.1 Sugar hydrolysate of sweet potato waste
Sweet potato waste was provided by Cilembu Village, Sumedang. Sweet potato waste (Cilembu variety) was washed with water to ensure the removal of soil and other contaminants. Sweet potato waste was then sliced using a knife and dried in an oven at 80°C for 24 hours. Dried sweet potato waste was ground using a blender for 5–10 minutes until a fine powder was obtained. A 50-gram sample of dried sweet potato powder was taken for proximate analysis. Sweet potato powder was added to a 500 mL Erlenmeyer flask at an initial concentration of 13% (w/v). Subsequently, 9% (w/v) of the powder was added every 3 hours in a fed-batch enzymatic system until the 9th hour, reaching a total concentration of 40% (w/v). Along with the initial 13% addition, cellulase, amylase, and pectinase were added at a total enzyme loading of 30 mg enzyme per gram of sweet potato powder, with a ratio of 4:1:1, respectively [3]. Hydrolysis was conducted in a 250 mL Erlenmeyer flask with a working volume of 150 mL and a substrate amount of 80 g, at 50°C with agitation for 24 hours, using 0.2 M sodium acetate–acetic acid buffer at pH 5.2. The resulting hydrolysate was then centrifuged at ~4,000 G for 20 minutes. Supernatant and solid residue were separated by centrifugation, followed by filtration using a Büchner funnel. The collected supernatant was then transferred into several beakers and subjected to lyophilization to obtain sugar hydrolysate powder.
2.2 Gluconacetobacter xylinus
G. xylinus was used as the cellulose-producing bacterium in this study. The strain was obtained from the Indonesian Culture Collection (InaCC), National Research and Innovation Agency (BRIN), Indonesia. The culture was maintained on Hestrin-Schramm (HS) agar medium at 30°C prior to use in fermentation experiments.
2.3 Fermentation conditions
Before the fermentation process, a complex medium for G. xylinus bacteria was prepared using 30 g/L sugar hydrolysate powder, 5 g/L yeast extract, 5 g/L peptone, 2.7 g/L Na2HPO4 and 1.15 g/L citric acid in an Erlenmeyer flask. The Erlenmeyer flask containing the medium solution was sterilized using an autoclave at 121°C for 15 minutes [4]. This complex medium was prepared with variations of pH 4, pH 5 and pH 6 and the addition of glucose of 2 g/L, 4 g/L and 6 g/L. This sterile complex medium was inoculated with G. xylinus bacteria as much as 2%, 6% and 10% of the total working volume and then fermented statically at room temperature for 14 days until pellicle formed. Fermentation conditions in the form of pH, % inoculum and substrate addition were determined using RSM which can be seen in Table 1.
Table 1.
Response Surface Methodology (RSM) matrix
2.4 Post-production of bacterial nanocellulose
After the fermentation process is complete, a cellulose layer is formed. The cellulose is harvested and then boiled in distilled water at 70°C for 3 hours [5]. The boiled cellulose was then washed with 2.5% NaOH for 30 minutes at 60°C using a shaker. After washing with NaOH, the cellulose is rinsed again with distilled water to neutralize the pH. Once purified cellulose is obtained, freeze it at -80°C using the deep freeze, then dry it using a freeze-drying method until it has a constant weight [6]. The dried cellulose is then weighed to determine the yield of BNC and stored in waterproof, airtight containers for subsequent testing.
2.5 Proximate analysis
A small portion of the obtained Cilembu sweet potato powder was taken for proximate analysis, which included protein content analysis using the Kjeldahl method, fat content analysis using the Soxhlet method, and ash content analysis using a furnace.
Moisture content calculation was performed using the gravimetric method by drying the sample at 105°C until constant weight was achieved [7].
Ash content was determined by ashing the sample at 550°C until grayish-white ash was obtained [8]. The equation for calculating ash content is presented in Eq. (2).
Fat content was analyzed using the Soxhlet extraction method with organic solvents such as petroleum ether or hexane [9]. The equation for calculating fat content is presented in Eq. (3).
Protein content was determined using the Kjeldahl method, which involves sample destruction with sulfuric acid, distillation, and titration [10]. Protein content was calculated using Eq. (4).
where, is the normality of the HCl solution used for titration, is volume of HCl used in titration and 6.25 is the conversion factor from nitrogen to protein.
Carbohydrate content was determined by difference, by subtracting the total percentage of moisture, ash, fat, and protein content from 100% [11]. The equation for calculating carbohydrate content is presented in Eq. (5).
2.6 Sugar analysis (DNS & HPLC)
Sugar analysis was conducted using two methods: reducing sugar quantification via the DNS (3,5-dinitrosalicylic acid) method and sugar profiling using high-performance liquid chromatography (HPLC; LC-2050C, Shimadzu, Japan). The DNS method was employed to monitor the kinetics of reducing sugar consumption throughout the 14-day fermentation process, whereas HPLC analysis was performed to quantify the concentrations of various sugar types before fermentation and on day 14 after fermentation. The kinetics of substrate consumption were analyzed using the DNS method, in which 3 mL of DNS reagent was added to 3 mL of sample in a test tube. The mixture was heated for 5 minutes and then cooled to room temperature. After cooling, 1 mL of Rochelle salt was added, and the absorbance was measured at 575 nm using a spectrophotometer [12]. Quantification of individual sugar concentrations was carried out using HPLC equipped with a refractive index (RI) detector with Aminex HPX-87P column, 300 × 7.8 mm (Bio-Rad), mobile phase ultrapure water, flow rate 0.5–0.6 ml/min, and column temperature 80–85°C Sample preparation start from centrifugation followed by the collection of the supernatant, which was subsequently diluted 100-fold. The diluted samples were transferred into 10 mL Falcon tubes and used for analysis with an injection volume of 20 µL and a total run time of 25 minutes.
2.7 Microbial growth quantification
Growth kinetics were determined using hemocytometer counting by introducing the liquid sample into a microscale counting chamber, followed by manual cell enumeration. Each chamber accommodates a maximum of 30–45 cells; if the count exceeds this range, the sample was diluted accordingly. The dimensions of each chamber in the hemocytometer are 0.04 mm2 × 0.1 mm, which were used in calculating the number of cells per milliliter [13]. Growth kinetics were assessed under agitated fermentation conditions to evaluate microbial behavior under non-stress (normal) conditions. Cell counts from each sampling point were calculated using the equation presented below.
Quantification of growth kinetics included the specific growth rate, doubling time, and product yield based on substrate consumption, all calculated using the following equations.
where, 𝜇 : specific growth rate (h-1)
: cell count at the end of the exponential phase (cell/mL)
: cell count at the beginning of the exponential phase (cell/mL)
: time at the end of the exponential phase (h)
: time at the beginning of the exponential phase (h)
where, 𝜇 : specific growth rate (h-1)
: doubling time (h)
where, : product yield based on substrate consumption (g product/g substrate)
: final product concentration – initial product concentration (g/L)
: initial substrate concentration – final substrate concentration (g/L)
2.8 Statistical analysis
Statistical analysis were performed using Minitab software. To optimize fermentation conditions for maximizing BNC dry yield, three key factors were selected as independent variables: pH (X1), inoculum percentage (X2, % v/v), and D-glucose concentration (X3, g/L). These variables were chosen based on their known influence on microbial growth and product formation. A Box–Behnken Design (BBD) under RSM was employed, with each factor studied at three levels: low (−1), center (0), and high (+1). The actual coded and uncoded values of each variable are presented in Table 1, along with 15 randomized experimental runs, including three replicates at the center point to assess experimental error and model adequacy. The BBD approach is suitable for exploring quadratic response surfaces while minimizing the number of experimental runs, making it efficient and cost-effective for optimizing complex biological processes.
Second-order polynomial regression model (full quadratic model) was fitted to the response variable, namely the dry yield of BNC (Y), as shown in Eq. (10).
where, is the response (dry BNC yield); is the intercept; , , and are the coefficients of the linear terms; , , and are the coefficients of the quadratic terms; , , and represent the interaction effects between the variables; and 𝜖 is the random error. Model simplification was performed by eliminating terms with p-values greater than 0.05, resulting in a reduced model containing only significant predictors. Model adequacy was evaluated through lack-of-fit tests and the coefficient of determination (R2).
2.9 X-ray diffraction
The X-ray diffraction (XRD; D8 Advance, Bruker, Germany) is used to analyze changes in cellulose crystallinity. The freeze-dried samples were cut to a size of 1 cm × 1 cm and analyzed using Ni-filtered Cu Kα radiation with a wavelength of 0.154 nm. The generator current is set at 30 mA and the voltage at 10 kV, with data recorded at an increment of 2 degrees per minute over a range of 5–60° 2θ. The degree of crystallinity of BNC can be determined using an empirical method, as shown in the following equation:
where, is the diffraction peak intensity and is the intensity value corresponding to the minimum diffraction between crystal planes [14].
2.10 Scanning electron microscopy
Scanning electron microscopy (SEM; SU3500, Hitachi, Japan) was employed to observe the surface morphology of BNC samples [15]. Prior to imaging, the dried samples were coated with a thin layer of gold using a sputter coater to enhance conductivity. SEM analysis was performed with the operation condition as shown in Table 2.
3. Results and Discussion
3.1 Proximate analysis
The proximate composition of rotten sweet potato was determined through standardized analytical methods, following gravimetric, Soxhlet, and Kjeldahl methods procedures. The comprehensive analysis revealed the distribution of major nutritional components, providing essential information for processing into fermentable sugars. Table 3 presents the complete proximate composition data obtained from triplicate analysis.
Table 3.
Proximate analysis for fresh and rotten sweet potato
| Content | Fresh sweet potato (%) | Rotten sweet potato (%) |
| Moisture content | 36.01 | 30.91 |
| Ash content | 3.63 | 3.06 |
| Carbohydrates content | 55.95 | 49.25 |
| Fat content | 1.38 | 4.34 |
| Protein content | 3.03 | 12.44 |
The analytical results demonstrate substantial differences from fresh sweet potato composition. Fresh sweet potato roots typically contain 36.01% moisture, whereas the rotten sample exhibited only 30.91% moisture content. The ash content of 3.06% falls within the reported range for fresh sweet potato 1–4%, suggesting that mineral composition remained relatively stable during spoilage. This moderate mineral content contributes essential nutrients for potential fermentation processes [16].
Despite spoilage-induced changes, the proximate composition indicates that the rotten sweet potato retains significant potential for sugar fermentation applications. The 49.25% dry-basis carbohydrate content, consisting primarily of starch, represents a substantial reserve for conversion to fermentable sugars through enzymatic hydrolysis. The reduced moisture content presents both challenges and opportunities for processing. While the material requires rehydration for efficient enzymatic saccharification, the concentrated nature allows for higher sugar concentrations in fermentation systems compared to fresh tuber processing. Literature demonstrates that sweet potato flour with low moisture content can achieve superior fermentation efficiency through this concentration effect [17].
3.2 Microbial growth kinetics
A bacterial growth curve is a graph showing the number of viable bacterial cells in a bacterial colony over time. It consists of four phases: lag, exponential, stationary, and death. The bacterial growth curve can be seen in Fig. 1.
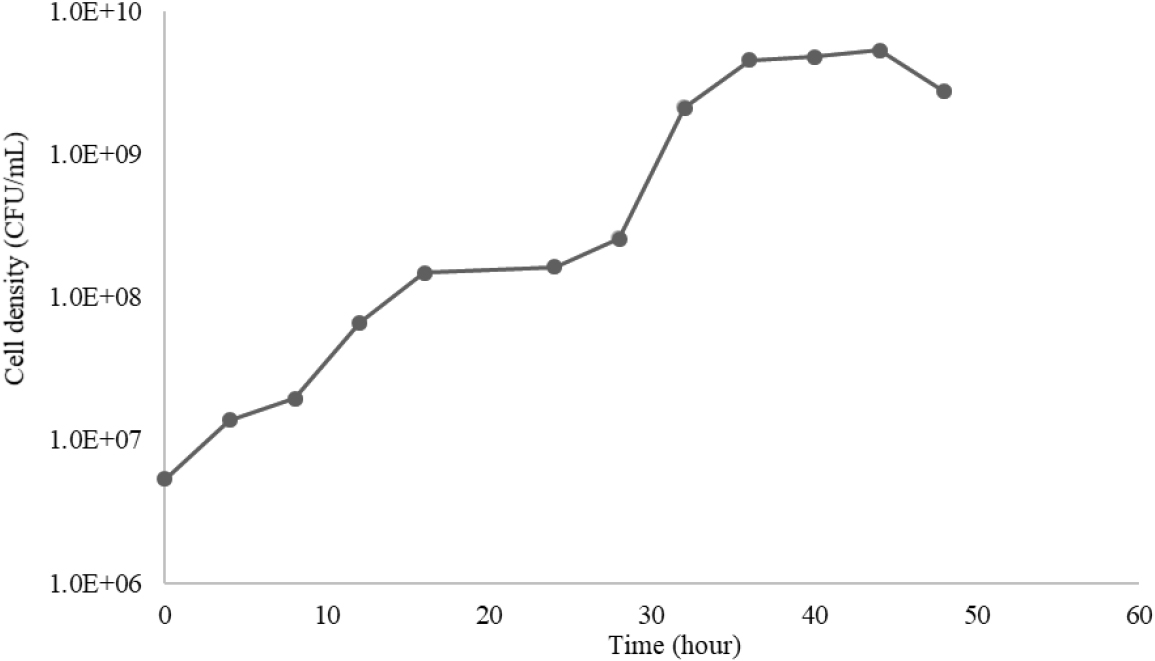
In Fig. 1, the G. xylinus bacteria did not experience a lag phase and immediately entered the first log phase from 0 to 16 hours, and the second log phase from 28 to 36 hours, followed by the stationary phase. The specific growth rate (µ) for both log phases is µ1 = 0.2072 hours-1 and µ2 = 0.3598 hours-1. The doubling time (td) for both log phases is td1 = 3.681 hours and td2 = 2.255 hours. The lag phase did not occur because the G. xylinus bacteria had previously grown in a similar medium, so they did not need to undergo an adaptation phase and could immediately undergo cell division [18]. The occurrence of two logarithmic phases indicates that the medium used has two main substrates, supported by the results of sugar analysis using HPLC, where there are two types of sugar in sweet potato sugar, namely glucose and fructose. In the first logarithmic phase, bacteria will use glucose first, then make a transition to using fructose, causing the second logarithmic phase [19]. This phenomenon is called catabolic repression, a control mechanism that occurs when there is more than one carbon source in the microbial growth substrate, resulting in a shift in substrate use from glucose to other types of sugar [20].
3.3 Sugar consumption analysis
Substrate consumption kinetics were also considered as part of the overall fermentation kinetics, as illustrated in Fig. 2, which presents the substrate consumption profiles for each fermentation condition.

As shown in Fig. 2, the concentration of reducing sugars decreased from day 0 to day 3, followed by an increase from day 3 to day 12, and a slight decrease in some fermentation conditions on day 14. This trend indicates an initial depletion phase, followed by an increase in reducing sugar concentration between day 3 and day 12, likely due to bacterial activity in breaking down disaccharides—particularly maltose—into monosaccharides, which can then be utilized for microbial growth [21]. Disaccharides such as maltose possess fewer reducing ends compared to their monosaccharide components, such as glucose; hence, when measured as glucose-equivalents (ppm glucose-eq), maltose yields a lower absorbance signal than its hydrolysis products [22]. The sharp decline in reducing sugar concentration observed from day 0 to day 3 was a result of the rapid bacterial consumption of monosaccharides such as glucose and fructose, which were initially present at concentrations above 15,000 ppm across all fermentation conditions, resulting in a significant reduction of 92% to 97%.
Sugar consumption analysis was performed not only using the DNS method, but also through HPLC at the beginning (day 0) and the end of the fermentation period (day 14). The HPLC results showing the consumption levels of each sugar type in the condition with the highest BNC yield are presented in Fig. 3.

Based on Fig. 3, it can be observed that the sugars present in the Cilembu sweet potato hydrolysate supplemented with 4 g/L D-glucose consist primarily of maltose, fructose, and glucose. The figure also shows that in the optimal fermentation condition (A5) with pH 6, 10% initial inoculum, and 4 g/L D-glucose supplementation, glucose had the highest concentration among all sugar types, reaching 14,807 ppm, and was completely consumed (100%), as indicated by the absence of residual glucose after 14 days of fermentation. Another major monosaccharide present was fructose, with an initial concentration of 4,174 ppm and a consumption rate of 96.06%, leaving only 164 ppm at the end of fermentation. In addition to monosaccharides, the hydrolysate also contained the disaccharide maltose at a concentration of 3,490 ppm, with 69.04% consumed, leaving 1,080 ppm on day 14. These results suggest that G. xylinus preferentially consumed monosaccharides over disaccharides. The high consumption of monosaccharides is consistent with the reducing sugar consumption trend observed using the DNS method discussed previously. Furthermore, the HPLC results support the occurrence of diauxic growth in G. xylinus, as evidenced by the presence of multiple sugar types in the complex substrate derived from Cilembu sweet potato waste hydrolysate. Based on the sugar consumption profile, the calculated product yield on substrate (Yp/s) was 0.168 g/g. The diversity of sugar types in the substrate was identified to determine their composition and concentrations, as these components are known to influence bacterial growth and the characteristics of the resulting BNC.
3.4 Bacterial nanocellulose production
As shown in Fig. 4, the highest wet weight of BNC was obtained under the conditions of pH 6, 10% initial inoculum, and 4 g/L D-glucose addition (variation A5), yielding 20.0 grams (wet basis) of nanocellulose. In contrast, the lowest yield was observed in variation C4 (pH 5, 10% inoculum, and 2 g/L D-glucose), with a wet weight of 8.9 grams. BNC production generally increased over time. From day 0 to day 3, a lag phase was observed in which the increase in nanocellulose mass was not yet significant or had not occurred in several variations.
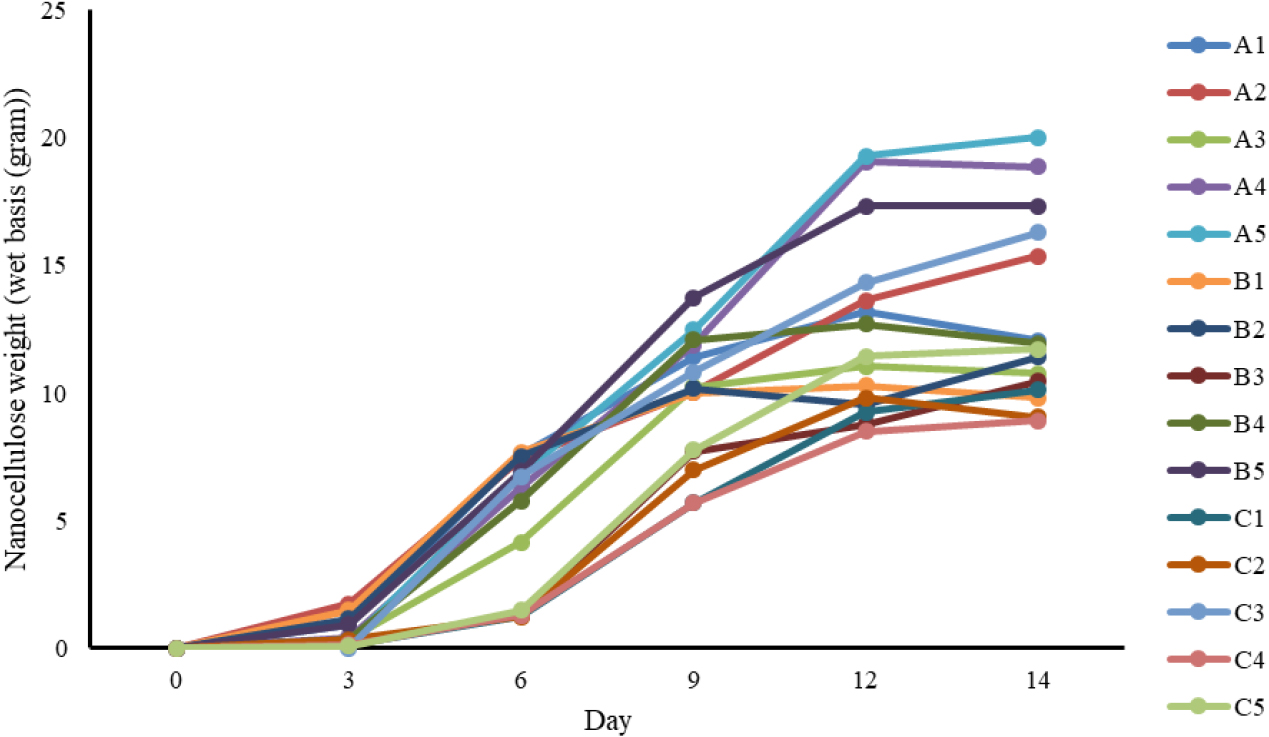
This was followed by a logarithmic increase in production between day 3 and day 12, reaching an apparent stationary phase by day 14 in multiple conditions. The highest productivity among all variations was also recorded in variation A5, with a value of 0.284 g/L/day. The nanocellulose measured on a wet basis was subsequently dried, and the results are presented in Table 4. The formation and appearance of BNC during the production process are illustrated in Fig. 5, which shows the fermentation process in Erlenmeyer flasks, the wet BNC after harvesting, and the dried BNC sheet after purification and drying.
Table 4.
Yield and water content

As indicated in the table, the moisture content of all BNC samples met the standard for BNC hydrogels, with a minimum moisture content of 95% of the total weight [23]. A high moisture content reflects high porosity and hydrophilicity, which supports its suitability for biomedical applications, particularly as wound dressings [24].
3.5 Optimization of fermentation condition (Box-Behnken Design)
Optimization of fermentation conditions was performed using RSM with a Box–Behnken design. Three independent variables—pH, inoculum percentage, and D-glucose concentration—were evaluated, with BNC dry yield as the response variable. To evaluate the effects and interactions of the selected fermentation variables on BNC production, a second-order polynomial regression model was developed based on the RSM using a Box–Behnken Design. The model describes the relationship between the independent variables (pH as X1, inoculum percentage as X2, and D-glucose concentration as X3) and the response variable, namely the dry yield of BNC. This model was used to analyze the significance of each factor and their interactions, as well as to predict the optimal fermentation conditions. The resulting regression equation, along with its statistical evaluation, is discussed below.
The polynomial model exhibited a lack-of-fit p-value of 0.213, indicating that the model adequately fits the experimental data. The interaction effects between independent variables, as assessed through two-way ANOVA, yielded the following p-values: pH × inoculum = 0.881, pH × substrate addition = 0.522, and inoculum × substrate addition = 0.010. These results indicate that only the interaction between inoculum percentage and D-glucose supplementation had a statistically significant effect on BNC yield (p < 0.05), while the other interaction terms were not significant. The optimized conditions were determined using the regression model previously described. The optimized conditions obtained are presented in the Table 5.
Table 5.
Optimized condition from the model
| Response optimization | |
| pH | 5.74 |
| Initial inoculum (%) | 10 |
| Substrate addition (g/L) | 6 |
| Yield response (g) | 0.19804 |
Further analysis using one-way ANOVA showed that pH and inoculum percentage had significant individual effects on the response, with p-values of 0.000 and 0.020, respectively. Meanwhile, D-glucose concentration exhibited a marginal effect (p = 0.059), indicating that its influence on BNC production was limited under the tested conditions. This finding suggests that the dependency on pure glucose as a supplemental carbon source is relatively low and that the fermentable sugars present in the Cilembu sweet potato waste may be sufficient to support efficient nanocellulose biosynthesis. The high coefficient of determination (R2 = 94.75%) further confirms that the model reliably explains most of the variation in the response, validating its use for evaluating factor effects and optimizing fermentation conditions. To visualize the findings from the ANOVA, a Pareto chart of standardized effects was used to depict the relative influence of each variable and its interactions on BNC yield. The chart presents the standardized t-values of the regression coefficients in descending order, with a reference line corresponding to a significance level of α = 0.05. The Pareto chart of standardized effects is presented in the Fig. 6.

Contour plots were constructed to provide a graphical representation of the interaction effects among variables, aiding in the identification of optimal regions for maximum BNC yield. Fig. 7 shows the contour plots illustrating the interaction effects of (a) pH and inoculum concentration, (b) pH and glucose substrate addition, and (c) inoculum and substrate addition on BNC yield. These plots reveal that higher yields are generally associated with moderate PH levels around 5.5–6.0 and higher inoculum concentration. Fig. 8 displays the corresponding three-dimensional surfaces plots, providing a more detailed visualization of the relationships between the process parameters. The curvature of the surfaces indicates significant interaction among variables, particularly between PH and inoculum concentration, which had the most pronounced influence on yield. The optimal region is observed at approximately PH 5.7 and 10% inoculum, where the predicted BNC yield reaches its maximum. These graphical analyses confirm the statistical results obtained from the RSM model.


3.6 Characterization of bacterial nanocellulose
Fig. 9 displays the XRD patterns of samples A5, B5, and C5. Samples of nanocellulose with XRD showed clear crystallinity patterns that matched the normal cellulose structure. Characteristic peaks were seen in all samples at 2θ ≈ 15–16° and ≈22°, with a lesser reflection around 34°. Crystallinity measurements, however, revealed a great deal of variation: sample A had a crystallinity of 77.24%, sample B had a crystallinity of 71.05%, and sample C5 had a far lower crystallinity of 53.5%. High crystalline order was indicated by the strong, powerful peaks in samples A5 and B5, especially the conspicuous peak at about 22°. Sample C5, on the other hand, displayed noticeably weaker and broader peaks, indicating a lower crystalline structure and a higher amorphous proportion [25].

Different synthesis conditions, such as pH, glucose content, and inoculum amounts, cause these variations in crystallinity. According to research, the growing circumstances and medium composition have a major impact on the crystallinity of bacterial cellulose. While quick glucose metabolism usually results in more amorphous cellulose, higher salt concentrations or buffering agents can decrease crystallinity. By accumulating disordered cellulose networks, prolonged fermentation times also tend to reduce apparent crystallinity [26]. In the C5 sample, which was cultivated at PH 5 with a 10% inoculum and 6% glucose supplementation, the high glucose concentration and high inoculum under acidic conditions likely promoted the formation of gluconic acid via the activity of glucose dehydrogenase located in the bacterial cell membrane. The resulting acidification of the medium may have interfered with the orderly assembly of cellulose microfibrils, leading to the production of BNC with relativity low crystallinity. This finding is consistent with the results reported by Abraham et al. [27], who demonstrated that when glucose is converted to gluconic acid via the membrane-bound glucose dehydrogenase pathway, the accumulation of gluconic acid disrupts inter-chain hydrogen bonding among glucan chains. This disruption, either through direct interference or by reducing fibril concentration, leads to a substantial decrease in BNC crystallinity by as much as 60%.
Fig. 10 presents the SEM micrographs of BNC obtained under different fermentation conditions for samples A5, B5, and C5. The three samples display a typical entangled nanofibrillar network characteristic of BNC, although differences in fibril arrangement and density are evident. Samples A5 shows a relatively uniform network with moderately thick nanofibrils, while sample B5 exhibits a denser, fiber-like structure resulting from the partial aggregation and bundling of nanofibrils. In contrast, sample C5 demonstrates a more loosely packed network with finer fibrils and greater porosity. Quantitative analysis of fibril diameter using imageJ software indicated average diameters of approximately 74 nm, 77 nm, and 79 nm for samples A5, B5, and C5, respectively.
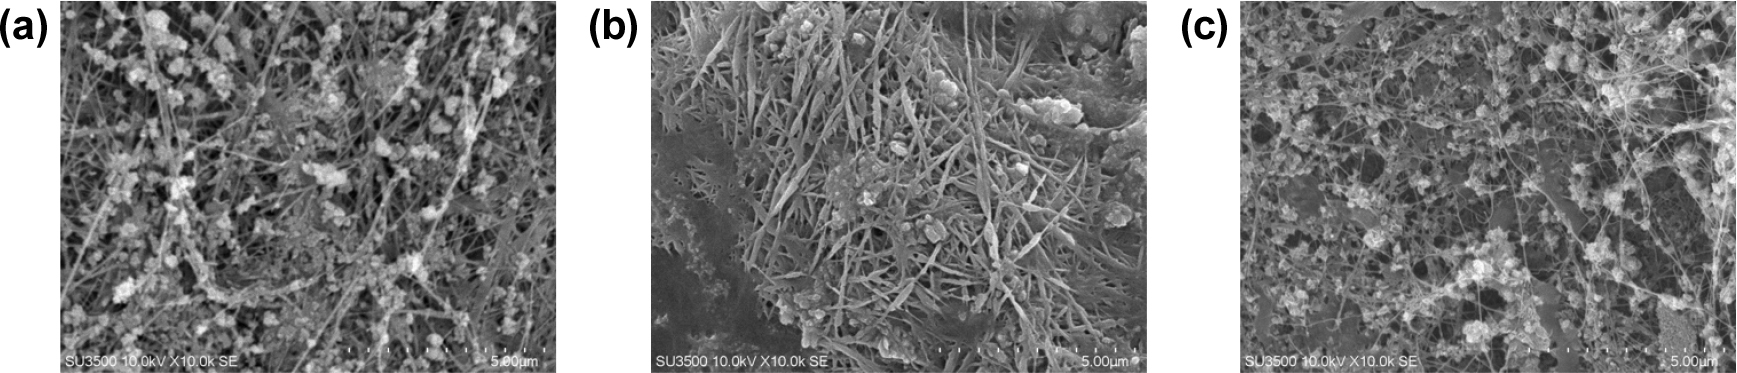
These morphological variations suggest that the fermentation parameters particularly inoculum concentration, pH, and glucose addition can influence the extent of fibril aggregation and network compaction, which in turn affect the visual appearance and structural characteristics of the resulting BNC [28].
4. Conclusions
This study highlights the potential for agricultural waste valorization through a statistical optimization approach for BNC production. The production of BNC using Cilembu sweet potato waste as a fermentation substrate was successfully optimized using RSM. The results showed that the interaction between the percentage of inoculum and the addition of glucose substrate significantly affected the BNC yield (p < 0.05). The optimum conditions of pH, inoculum percentage and D-glucose substrate addition of 5.74, 10% and 6 g/L, can produce a maximum BNC yield of 0.19804 g with morphological characteristics that have been confirmed by XRD and SEM analysis.
