

1. Introduction
Frequent paper breaks in the middle of the paper manufacturing process are the worst possible nightmare for papermakers.1) Loss of productivity, energy, raw materials, and manpower are often the results. A large amount of under-spec paper products produced during a paper break should be handled properly so that such products do not reach the customers. However, papermakers cannot avoid paper breaks, but they can reduce the frequency of breaks. The paper breaks in a paper machine usually occur at three sites: wet web pickup roll at the end of the wire, between the last wet press stack and the dryer section, and after the surface size press. The paper webs at those sites have a high moisture content, a significant amount of loading in the machine direction, and an abrupt change of running angle.
Papermakers usually install special devices and apply special technologies at these sites in order to prevent the paper breaks. However, paper breaks still occur, resulting in large economic losses. We need to know how much the wet web is susceptible to breaking at those sites for a better understanding of the paper breaks.1-5) The influencing factors include the dryness of the web, fiber types (mechanical or chemical pulp, softwood or hardwood), refining degree, paper machine speed, wire type, wet press type, size press type, and web tension. In this study, we focused on the first three factors (web dryness, fiber type, refining degree). The other factors are mainly due to the paper machine itself, which is difficult and expensive to change.
In this study, we measured the fracture toughness of paper webs under different dryness levels, fiber types, and refining degrees. Fracture toughness is not directly related to paper breaking, but until now, it is the best indicator known in this field so far. The measurement of fracture toughness is not easy at all, even nowadays. Paper is a nonlinear viscoelastic material and its load-elongation curve forms a curve with the initial rise of a straight line. Therefore, linear elastic fracture mechanics is not applicable, but elastic-plastic fracture mechanics is applicable. In paper mechanics, J integral6-10) and essential work of fracture11-15), which are applicable to nonlinear elastic materials, were used to estimate the fracture toughness. Tryding16) used a load-widening curve in the tension test, and obtained a fracture energy value per test specimen. We used both the essential work of fracture and the load-widening curve technique16) to estimate the fracture energy and fracture toughness.
2. Materials and methods
We used SwBKP (softwood bleached kraft pulp: a mixture of hemlock, Douglas fir, and cedar, Canada), HwBKP (hardwood bleached kraft pulp: a mixture of aspen and poplar, Canada), OCC (old corrugated container, donated by D Paper Co. in Korea), and ONP (old newspaper, donated by H Paper Co. in Korea) fibers and applied different refining times to the fibers in a valley beater. Their handsheet properties are presented in Table 1. The solid contents of the wet paper webs were controlled by changing the drying times (40%, 60%, 80%, and 95%). We made handsheets with a Williams handsheet machine (Daelim Paper Machinery Co. in Korea). After applying an identical wet pressing intensity and sequence, we varied the drying times of the wet webs, and sampled small pieces to measure their dryness levels. We kept the dryness of the wet webs until all of the physical testing was finished. The wet web was dried to the predetermined solid content, then put into a vinyl folder and sealed. This wet web was packed again in a second vinyl folder, and also sealed. The double- time packed wet web was kept in a refrigerator until testing. We checked the solid contents of the sample after 3 weeks in the refrigerator, and did not notice any significant changes.
Table 1.
Handsheet physical properties of the fiber furnishes
When testing the samples, we brought the sample in the vinyl folder, and cut the sample to the desired shape with the vinyl still attached. After the sample was securely connected between the grips in the tensile tester (Micro 350 tensile tester. Testometrics, England), we removed the vinyl, and ran the test. After the test, we measured the weight of the sample, and checked its solid contents. We found no significant differences in the solid contents of the samples before and after the test.
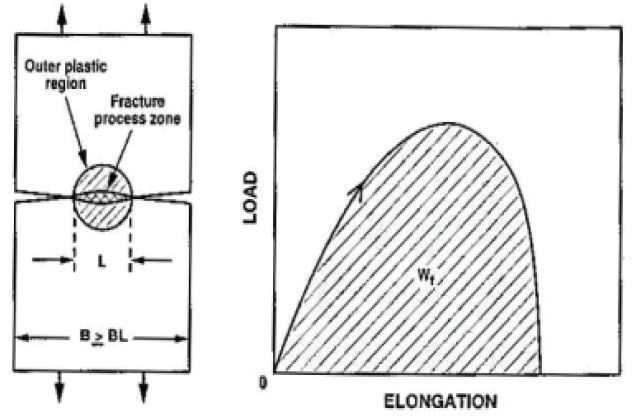
The measuring procedure of the essential work of fracture is simple and well known. We use deep double-edge notched tension specimens (DENT) containing varying ligament lengths (L), as shown in Fig. 1 and Fig. 2.15)
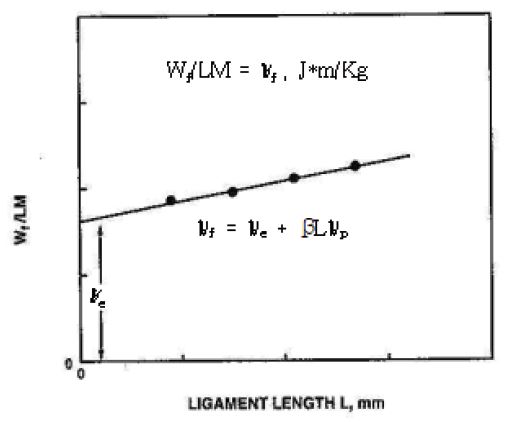
In the measurement of the essential work of the fracture of sample paper, we made a paper test specimen, as shown in Fig. 1, where we could find DENT specimen with B≥3L (B: sample width, L: ligament length). In Fig. 2, as the ligament length of the specimen changes, Wf (total strain energy of the specimen) changes. The intercept of the line is called the essential work of the fracture (We). It is already well established that We is a good estimate of the fracture toughness of a material independent of the specimen’s size and shape.15)
Another way of measuring fracture toughness is based on the analysis of the stress-widening curve at the stable fracture region suggested by Tryding16). In the stress-widening method, the specimen dimension should be controlled in such a way that the specimen fails at the stable fracture region in the tensile test. Fig. 3 shows a stable and an immediate unstable fracture. To make sure that the fracture occurs at the stable fracture region, one should find the appropriate length-to-width ratio of the specimen before the fracture test. How to select the ratio is well described in the reference16). Usually, at very low length-to-width ratio, a stable fracture occurs. In our experiment, we used the specimen dimension of 50 mm in width, and decided the span length depending upon the dryness level before the experiment by pretesting. For 40% and 60% dryness cases, a span length of 50 mm, for 80% dryness, a span length of 25 mm, and for 95% dryness, a span length of 15 mm was decided, respectively. At those length-to-width ratios, it was found that there were no unstable fracture or abrupt break of the samples.
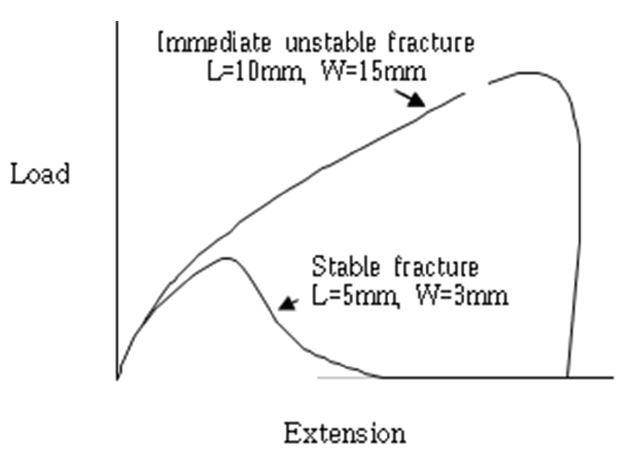
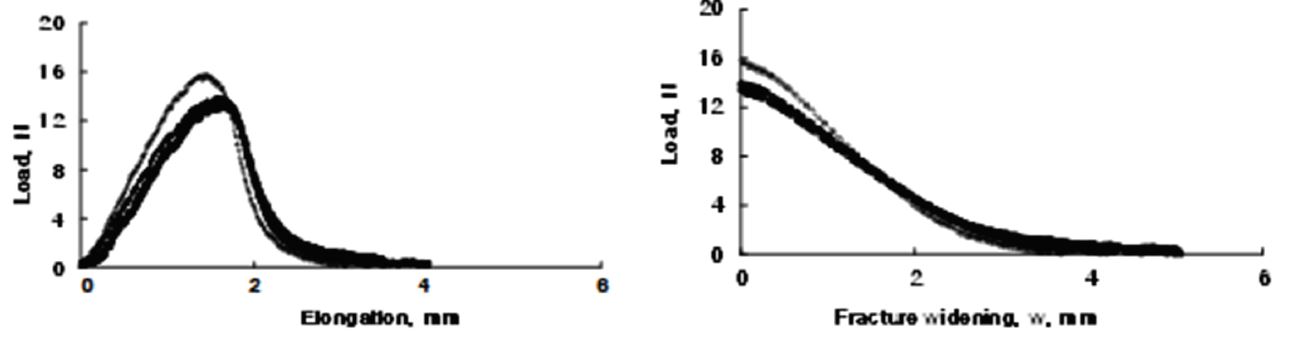
Fig. 4 shows the elongation vs. load and fracture widening vs. load curves in the tensile test. Multiple curves denote replication of the tests. The fracture widening curve starts from the peak load in the elongation vs. load curve, where the stable fracture starts. As elongation increases further from the peak load, the load decreases. We calculated the elongation loss caused by the load decrease after the peak load, and subtracted it from the total elongation. The resultant elongation is called fracture widening. The area under the fracture widening vs. load curve is the fracture energy, Gf, which can be calculated by numerical analysis.16)
3. Results and discussion
Four different fiber furnishes were used to investigate the change of fracture toughness at different dryness and refining levels. Their densities, breaking lengths, fracture toughness values, and stretches are shown in Table 2. In the handsheet making process, we controlled the dryness levels of the handsheets by varying the drying time.
In Table 2, the fracture energy values of softwood furnish were much higher than those of the other furnishes. We think that is because the softwood fibers are longer than the other fibers, and the paper containing the long fibers is difficult to break apart. Hardwood virgin fibers gave the lowest fracture energy at all dryness levels. Even the old newspaper furnish gave higher fracture energy than did the hardwood virgin bleached chemical pulp fibers. The OCC usually has longer fibers, and it did not surprise us by giving a higher fracture energy than that of the hardwood furnish.
Table 2.
Physical properties of the handsheets (100 g/m2)
Fig. 5 shows the close relationship between the essential work of fracture and Tryding’s fracture energy (R2 = 0.8835). Tryding’s method was very easy to implement, and gave a stable test value every time. The method needed only one sample for obtaining one fracture toughness value. However, the essential work of fracture needed at least four tests to obtain one fracture toughness value in the experiment. Furthermore, care should be taken in cutting the samples exactly up to ligament lengths. Two methods gave almost identical trends of fracture toughness variation, even though the dryness levels and the kinds of furnishes had changed.
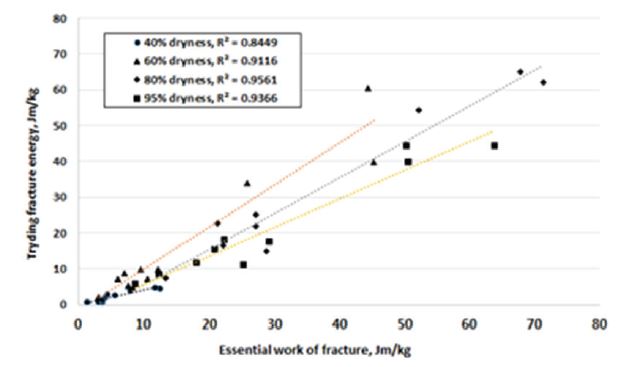
Fig. 5.
Relationship between the fracture toughness values measured by the essential work of fracture and Tryding’s load-widening method. The overall regression coefficient is 0.8835 (R2).
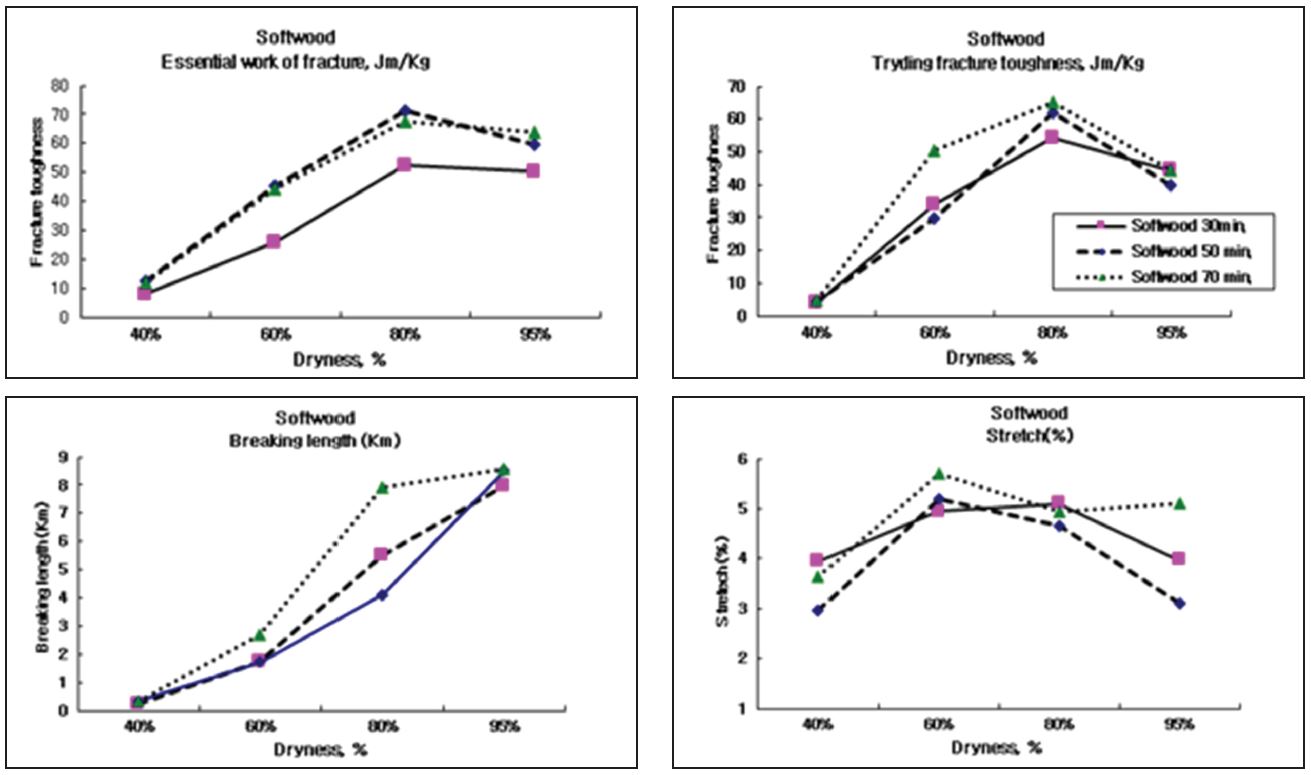
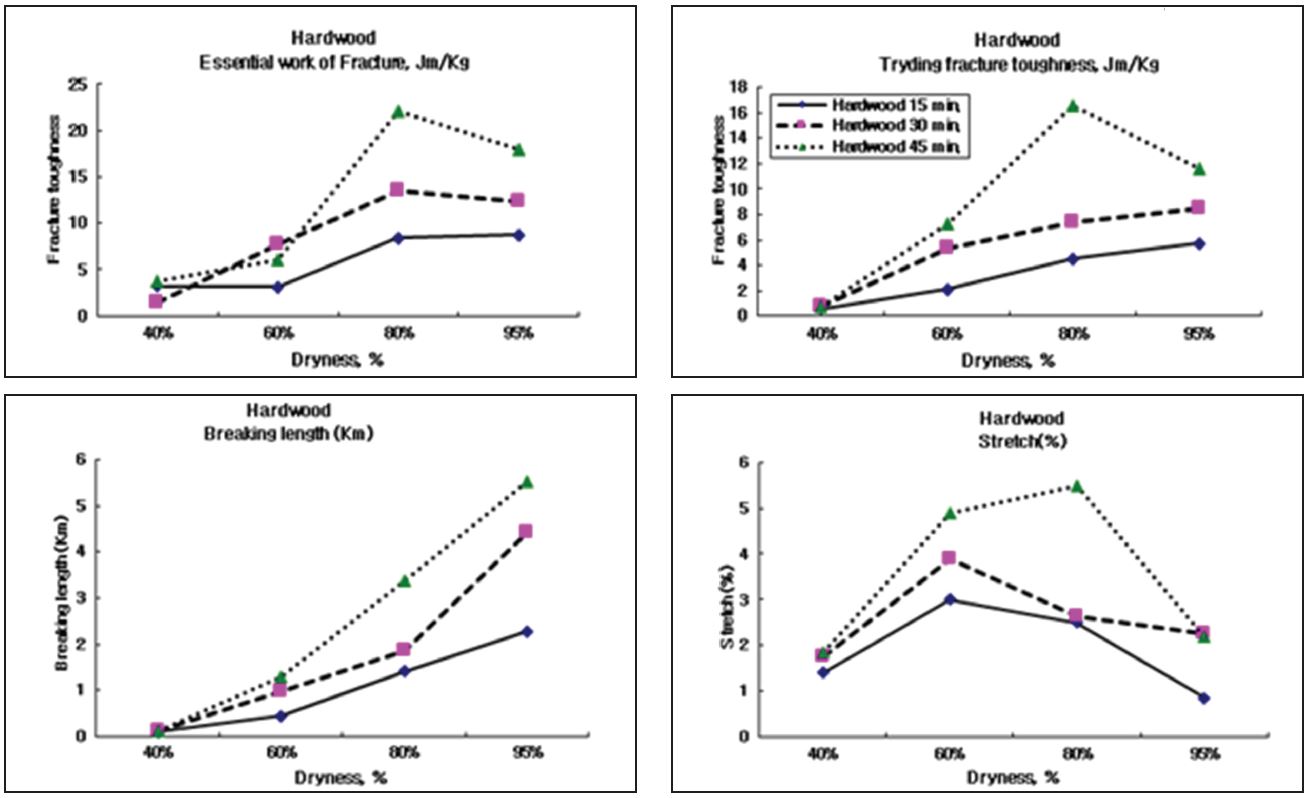
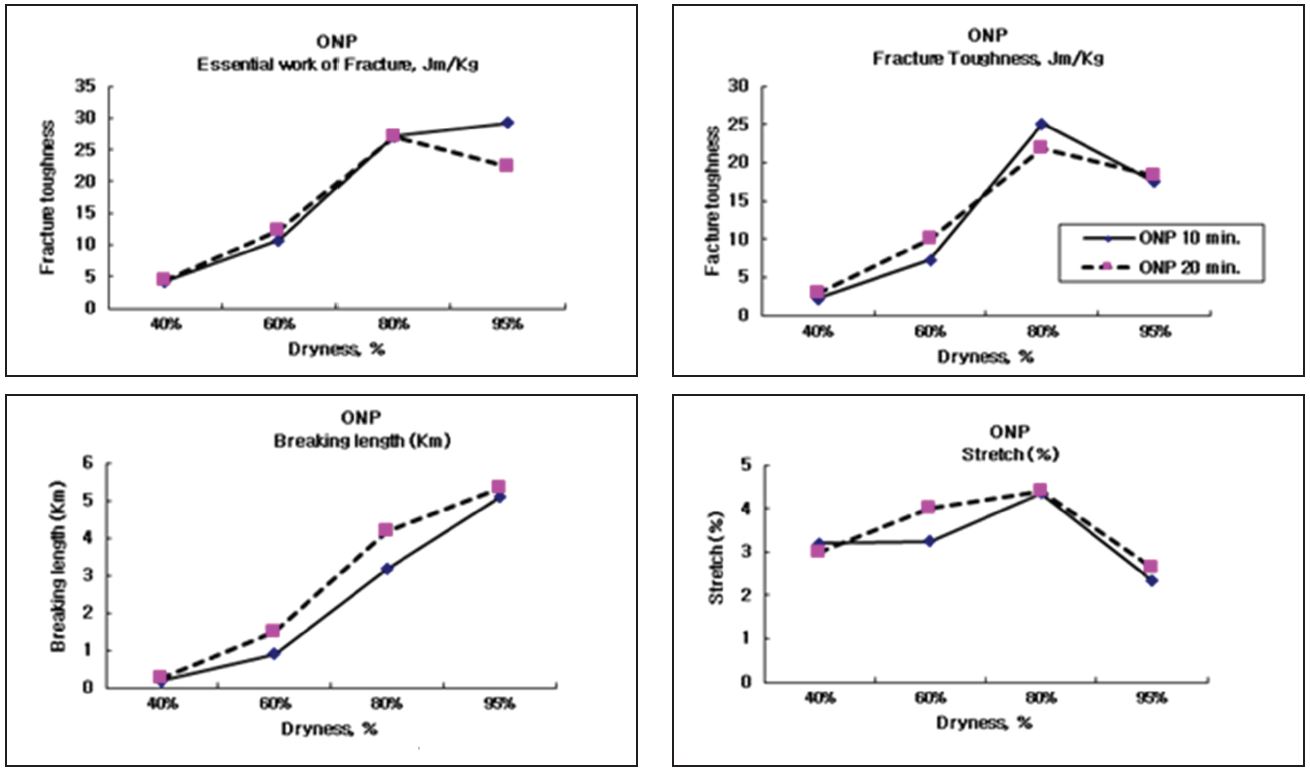
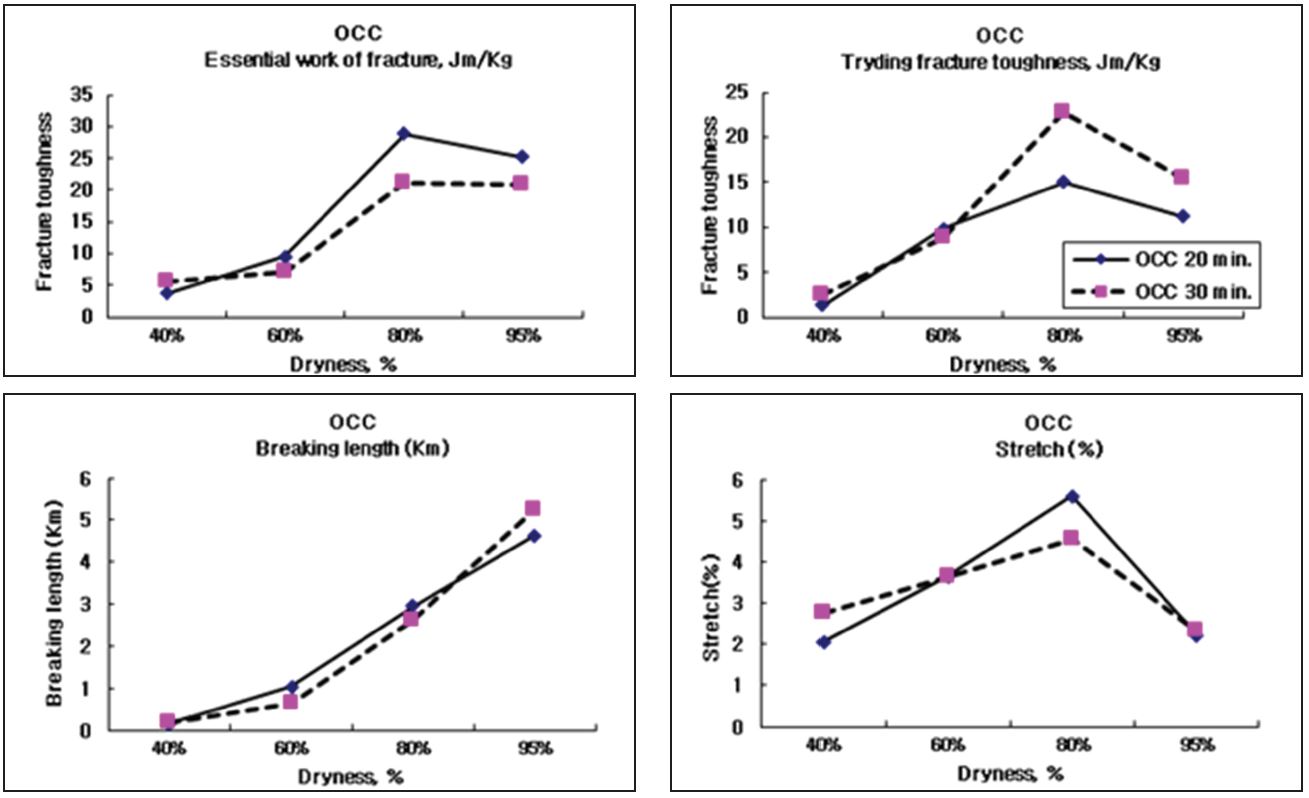
The curves of fracture energy, breaking lengths, and stretches of four different furnishes at 40%, 60%, 80%, and 95% dryness levels are shown in Figs. 6-9. Four different furnishes gave almost the same characteristic maximum of fracture energy at 80% solid contents. Another observation is that the stretches of four furnishes exhibited similar trends as the fracture energy (maximum at 80% and drop at 95% dryness level). If the fracture energy is high at a certain dryness level, we may expect the high stretch value of the wet web at that dryness level. Refining caused a higher breaking length and higher fracture energy for each fiber furnish.
The breaking length curves of the furnishes were different from those of the fracture energy and the stretch. The highest breaking length was always at the highest dryness level. Stretch values were low at 40% and 95% dryness levels, but were high at 60% and 80% dryness levels. Therefore during the papermaking process, care should be taken at around 40% dryness level, where both breaking length and stretch must be the lowest. At the 40% dryness level in the paper machine, the location of the paper is at or right after the wet press.
4. Conclusions
We measured the fracture energy values of four different fiber furnishes (SwBKP, HwBKP, ONP, and OCC) at four different dryness levels (40%, 60%, 80%, and 95%), while varying the refining time. Two different fracture toughness measurement methods, which were the essential work of fracture and the Tryding’s load-widening method, were used in the measurements. We found that the two measurement methods produced the same trends. A few conclusions were made as follows:
* The essential work of fracture and the Tryding’s load-widening method gave almost identical curves at different fiber furnishes and at each wet web dryness level.
* The Tryding’s method gave one fracture toughness value per test. It was much more convenient than the essential work of fracture method in practice.
* The fracture toughness and the stretch curves gave maximum values at around 80% dryness levels for four different fiber furnishes and at different refining degrees.
* The SwBKP gave the highest fracture toughness values at each dryness level.
* The HwBKP gave the lowest fracture toughness values (lower than ONP and OCC).
