

1. Introduction
Washing is one of the important links in the pulping process. Its main purpose is to wash the soluble inorganic and organic matter in the pulp to obtain high-concentration black liquor.[1] The most important quality indicators for evaluating pulp washing performance are the residual alkalinity of the washed pulp and the Baumé degree of the resulting concentrated black liquor. The conductivity of the residual soda extracted from the washed pulp is a measure of the dissolved solids content, and the residual soda in the washed pulp is expected to be as little as possible. The Baumé degree is used to express the consistency of the dope obtained in the first stage of the pulp washer, and it is required to be as high as possible in production.[2] It can be seen that these two indicators are incompatible. From a pulp washing point of view, more water is required for pulp washing, but the black liquor will be diluted by the increase in water. From the perspective of chemical recycling, it should reduce the steam consumption of black liquor during the evaporation and condensation process,[3] higher black liquor concentration and temperature are required, so the washing water should be used as little as possible. The key to these two conflicting requirements is a balance between the amount of wash water and the required pulp cleanliness.
To address these problems, several classical control schemes have been developed. Black liquor consistency control, residual alkali loss control, dilution factor optimization control, multi-component control, and model-based optimization control are produced. Since the loss of residual soda is not considered, the method of online measurement of Baumé is only implemented in some small production plants.[4] Aiming at the shortcomings of a single control, a residual alkali predictor is constructed based on predictive control.[5] If it is limited to the measurement and control of a certain parameter, more attention should be paid to the modeling and optimal control of the entire washing process. Model-based optimal control and multi-component control play a large role in the optimization of operation and control.[6] Model-based optimization control can analyze the relationship between variables according to the model. Data-driven modeling has been widely used in recent years. The method is based on online learning and calculation of control quantities, matching the current state through a large amount of process data. Thus, various static qualities required by the system are obtained. The characteristics of sample data are the main criterion for data-driven modeling, which means that the data speaks for itself.[7-9] It can transform high-dimensional data into low-dimensional data without losing important information. Pulping enterprises generate and store a large number of production parameters, equipment data, and process data every day, and these data imply information such as process changes, equipment operation, and fluctuations in working conditions. During the washing process, there are abundant online and offline measurement data, such as temperature, washing drum pressure difference, vacuum degree, pulp layer thickness, pulp concentration, pulp type, pulp hardness, freshwater addition, and washing times.
Given this, aiming at the characteristics of the pulping process, a data-driven operational-pattern optimization method to model and optimize the pulp washing process is proposed in this paper. The main contribution of this paper is to solve the soft sensor modeling problem and optimize the pulp washing process. The soft sensor model of residual base and Baumé degree is obtained by a two-step neural network. Soft sensing uses secondary variables that are easily measured online and analytical information offline to estimate unmeasured or hard-to-measure variables.[10] The core of soft perception is the model. Modeling based on neural networks is a broader application of soft sensor technology. Based on mechanism analysis. A soft sensor model of Baumé degree and residual alkali based on the Back Propagation (BP) network is proposed. In this model, we can predict wash quality by entering variables. Then guide the control action. Compared with the off-line calibration model, this method can improve the measurement accuracy. And achieved the multiple goals of high quality, high yield and low consumption. Aiming at the multi-objective optimization of pulp washing process, a new method for solving the non convex problem of multi-objective decision-making is proposed in this paper. In this case, the difficulty of decision-making is overcome.
2. Materials and Methods
2.1 Materials
The experimental process of data monitoring and calculation was carried out in an online detection and control laboratory of paper quality. Engineering operation was based on actual paper mill equipment. The experimental process was carried out in a paper mill in Wugong city, Shaanxi Province of China, The pulp washing process on-line measurement was applied in the paper machine 12 (PM 12), The width of the PM 12 is 5400 mm, and the design speed is 650 m/min.
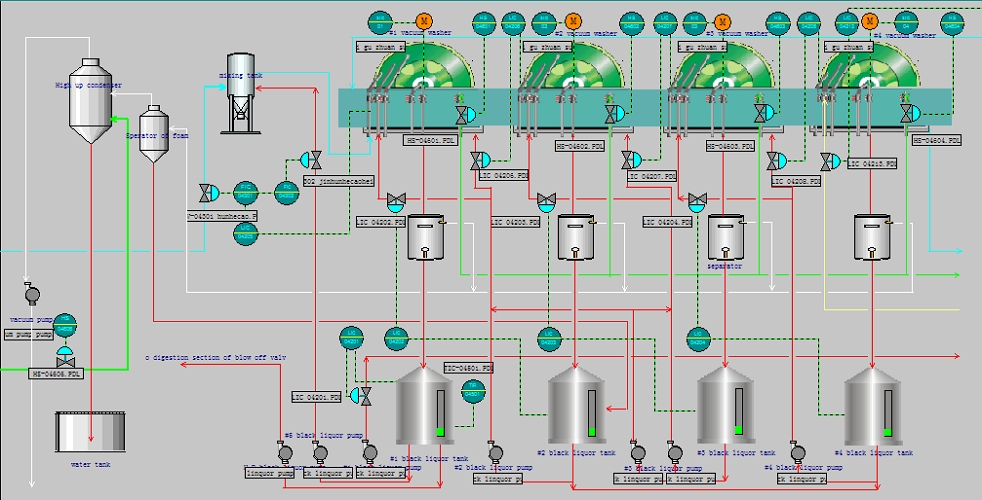
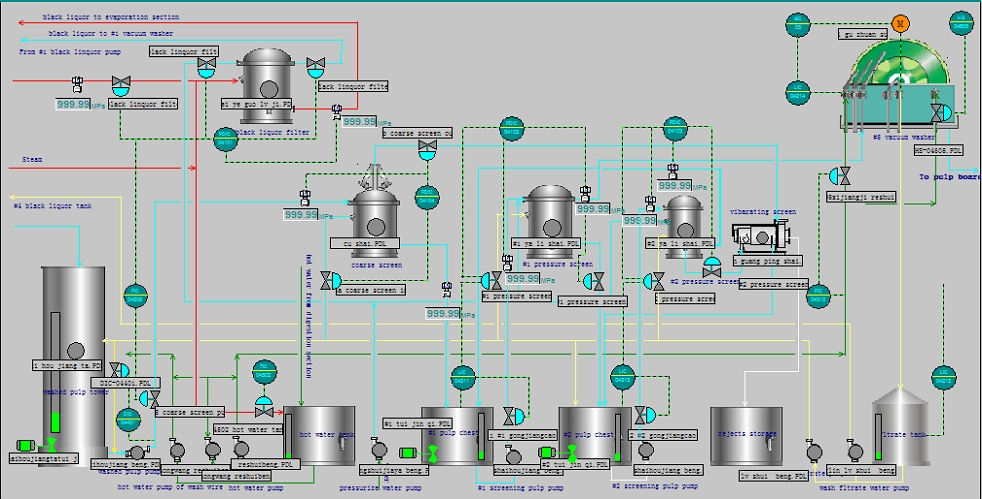
In the pulp washing control process, the software monitoring screen includes the main control screen and the monitoring screen of each subsystem. The main interface of pulp washing section is shown in Fig. 1. During the pulping process, the screening section and the pulp washing process are in the same workshop. The order of the two can be interchanged. For the wheat straw pulp studied in this paper, the screen section is located after the washing section, and the corresponding main screen is shown in Fig. 2.
2.2 Method
2.2.1 Crafts of the pulp washing process
At present, multi-stage countercurrent washing has been widely used in multiple washing machines (vacuum washing machines) in series, or one washing machine (cross-belt washing machine) is separated into multiple washing machines.[11] The pulp in this device is discharged from the previous stage, and the washing water is reversed from the previous stage. The reverse washing process can be briefly described as shown in Fig. 3.
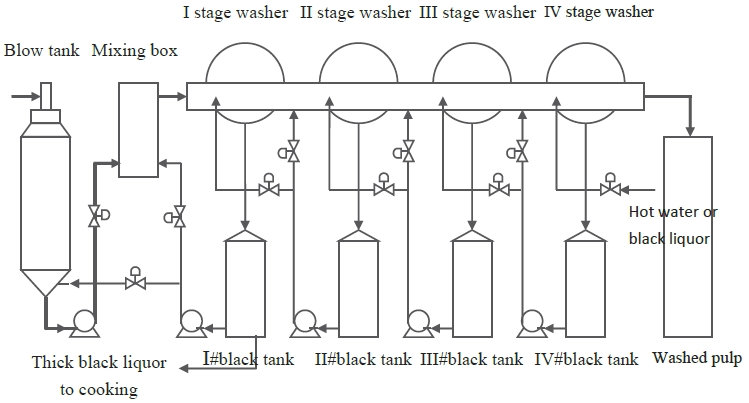
In this scrubber train, the pulp medium and the scrubber are typically arranged to flow countercurrent to each other. Freshwater is usually used to wash pulp boards on final washers. The filtrate is passed through the pulp on the previous scrubber. This helps to minimize dilution of the liquid separated from the pulp and recover cooking chemicals or cooking chemical residues therefrom. Therefore, it is desirable to keep wash losses as low as possible while using minimal wash water.
2.2.2 Measuring method of the process data
Based on Siemens S7-400 PLC hardware and WinCC 6.0 & Step7 software, an optimized control system for the pulp washing process was designed. The DCS structure is shown in Fig. 4.
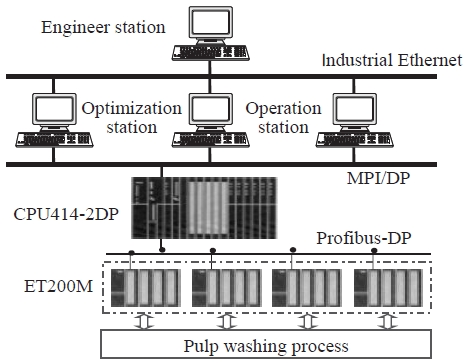
This system is a three-level control system. Field process data can be acquired and processed using a basic level of control. The multi-channel series coupling control operation is completed through linkage level coordination, and the residual alkali and Baumé degree soft measurement models and correction models are embedded in the DCS of the optimization station. In the top optimization layer, two parts of the work can be done, the measurement of the residual alkali and the Baumé degree of the black liquor and the goal of optimizing the production efficiency and cost. The base layer and the linkage layer ensure the smooth operation of the production. The optimization level keeps the production process at the optimal process through continuous real-time online parameters optimization.
3. Results
In this paper, a data-driven operating model optimization method is proposed to model and optimize pulp washing processes. The mathematical model of the washing process is determined, and the indicators meet the production requirements. Aiming at better product quality, low cost, and low energy consumption, the ant colony optimization algorithm based on the optimization operation mode database is used to solve the multi-objective problem. Theoretical analysis and practical application were carried out, and the pulp washing process optimization control system was designed. The actual results showed that the pulp output was increased by 20%, and the water consumption was reduced by nearly 30%. This method is effective during pulp washing. Details are described below.
3.1 The soft sensor models of the process
The steady mathematical model of the pulp washing process can be descried in Equation (1).
where x1 is inlet pulp consistency (kg/m3), x2 is inlet pulp flow (m3/h), x3 is hot clean water input flow (m3/h), y1 is residual soda in the final washed pulp (g/L), and y2 is Baumé degree in the first stage filtrate tank (Be). f1(x1,x2,x3), f2(x1,x2,x3) are steady models of residual soda and Baumé degree trained by BP neural network.
The steady-state data generated by the steady-state neural network model provides a reliable data source for the specific mathematical model of the residual soda and Baumé degree of the black liquor. The mathematical model of residual soda and Baumé degree was established by the least-square fitting of 200 groups of data in the steady-state model, as shown in Equation (2).
Regression analysis was performed on the estimates of parameters, and the results are shown in Tables 1 and 2. Regression analysis showed that 87% and 85% of the residual alkalinity and Baumé degree were explained by the linear model, and the fitting deviation approximately obeyed the normal distribution. The predicted value can accurately reflect the changes of these two indicators, which is beneficial to actual production.
Table 1.
Regression statistics of residual soda
| Multiple R | R-Square | Adjusted R-Square | Standard error | Observation data |
|---|---|---|---|---|
| 0.864969 | 0.848171 | 0.842029 | 0.023671 | 200 |
Table 2.
Regression statistics of Baumé degree
| Multiple R | R-Square | Adjusted R-Square | Standard error | Observation data |
|---|---|---|---|---|
| 0.754913 | 0.769893 | 0.759403 | 0.03092 | 200 |
150 sets of data were obtained as samples identified by the neural network steady-state model. The learning curve and generalization curve after training are shown in Fig. 5 and Fig. 6.
3.2 Optimization result of pulp washing process
The field data collection was carried out in a paper mill with wheat straw pulp as the main raw material in Luohe, Henan Province. According to the chaos optimization algorithm, the established steady-state neural networks of residual alkali and black liquor Baumé degree are optimized. The pulp washing process is further optimized from two aspects of single objective and multi-objective. The comparison of results before and after steady-state optimization control is shown in Table 3.
Table 3.
Result of stable-state optimal control
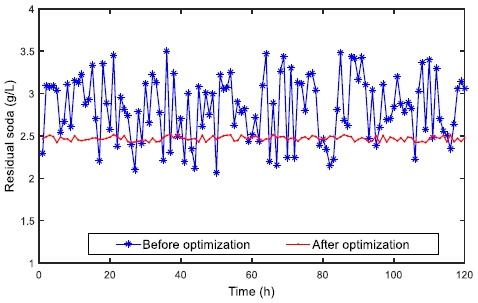
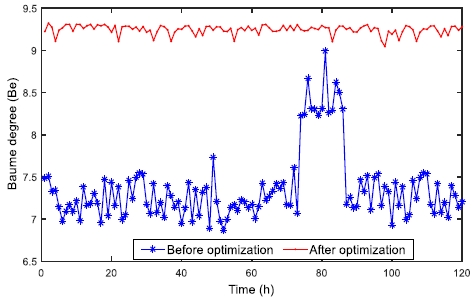
Through the three-level control, the process production is ensured, and the problem of higher and higher residual alkali and lower Baumé degree after washing is solved. The optimized residual alkali is reduced by no more than, and the Baumé degree of black liquor is significantly increased to 9.12 Be.
Based on the mathematical model of residual alkali and black liquor, on the premise of ensuring that the indicators meet the process requirements, the pulp output after washing is greatly increased, and the water consumption is significantly reduced. Taking the results of the optimization parameters of the pulp washing process as the system setting value, a trial operation was carried out in the paper group, and the operation results before and after the optimization were compared for 5 days.
Through a trial run in a pilot paper mill, a curve of the results of one week of operation is given and compared with the curve before optimization. As shown in Fig. 7 and Fig. 8.
4. Discussion
The soft sensor model of the process is established through neural network modeling, and based on the optimized operation mode database, the ant colony optimization algorithm is used to solve the multi-objective optimization of the pulp washing process. A detailed discussion follows.
4.1 Soft sensing and two-step neural network modeling
Neural networks play a very prominent role in the modeling, classification and prediction of nonlinear systems.[12] Using the neural network modeling method, the network structure between the main components and the quality variables was established, and the soft-sensor model of the pulp washing process was obtained.
In general, wash results are a function of many variables, such as wash water volume, feed consistency, air ingress, pulp making methods, wash water distribution, and discharge consistency. Most of these variables are interrelated, and improvements in one variable are likely to have favorable or unfavorable effects on other variables.[13] Since the PCA (Principle component analysis) method is used to preprocess the process variables such as noise reduction, dimensionality reduction, and negative correlation elimination.[14] It helps reduce the complexity of neural networks.
A large number of experiments show that the factors affecting the pulp washing quality include: sizing concentration, sizing flow, water addition, pulp layer thickness, vacuum degree, pulp type, washing water temperature, pulp hardness (degree of pulp cooking), pulping method, etc. These variables were screened out by the dynamic PCA method, and a mathematical model of the pulp washing process was established.
4.1.1 Two-step neural network
This paper adopts a two-step identification method. The basic idea of this method can be explained as follows.
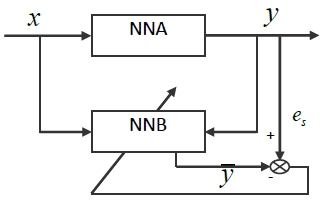
First, a dynamic model is obtained through a multilayer feedforward neural network with dynamic information of a process (e.g., step response). Second, using the obtained dynamic model, a steady-state dataset is generated as a training sample for the final steady-state model. Finally, another multilayer feed-forward neural network is trained to approximate the steady-state features of the process, thereby obtaining the final steady-state neural network model of the process. A schematic diagram of the method is shown in Fig. 9 and Fig. 10. The abbreviation of TDL (Tapped delay line)[16] refers to the delay unit according to the sampling period.
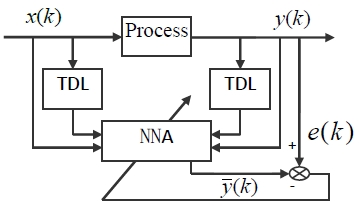
4.1.2 Neural network dynamic model identification
The dynamic NN mathematical model describing the pulp washing process is-
where x1 is inlet pulp consistency (kg/m3), x2 is inlet pulp flow (m3/h), x3 is hot clean water input flow (m3/h), y1 is residual soda in the final washed pulp (g/L), and y2 is Baumé degree in the first stage filtrate tank (Be)
where d is the length of input samples (d=3) and r1 and r2 are delay factors of residual soda and Baumé degree, respectively. According to a one-year field survey conducted in the pilot paper mill, the two delay factors are determined as r1=8 and r2=6.
Put the (d=3, r1=8, r2=6) into Equation (2). Then the number of independent variables for is 21, the number of independent variables for is 19. After training, the number of dynamic independent variables for residual soda and Baumé degree are 24 and 16. The structure parameters of the dynamic NN model for residual soda and Baumé degree are given in Table 4.
Table 4.
NN dynamic model parameters of r RS and BD
| Input layer | Hidden layer | Output layer | |
|---|---|---|---|
| Node number of RS | 24 | 27 | 1 |
| Node number of BD | 16 | 19 | 1 |
| Activating function | 1 / (1+e-s) | 1 / (1+e-s) | (1-e-s) / (1+e-s) |
It is found that the dynamic model trained by the BP algorithm based on L-M optimization is the optimal strategy. The adjustment weight of neural network is changed to:
Where, J(k) —Jacobian matrix of error differential with weight; e(k)—Error vector; μ—A scalar of adaptive adjustment.
The training parameters of the NN dynamic model of residual base and Baumé degree are shown in Table 5.
Table 5.
NN dynamic model training parameters of RS and BD
| Dynamic model | Learning rate | Initial value of μ | Increment of μ | Decrement of μ | Learning epochs | Error |
|---|---|---|---|---|---|---|
| RS | 0.3 | 0.001 | 10 | 0.1 | 56 | 0.0019 |
| BD | 0.11 | 0.001 | 10 | 0.1 | 67 | 0.002 |
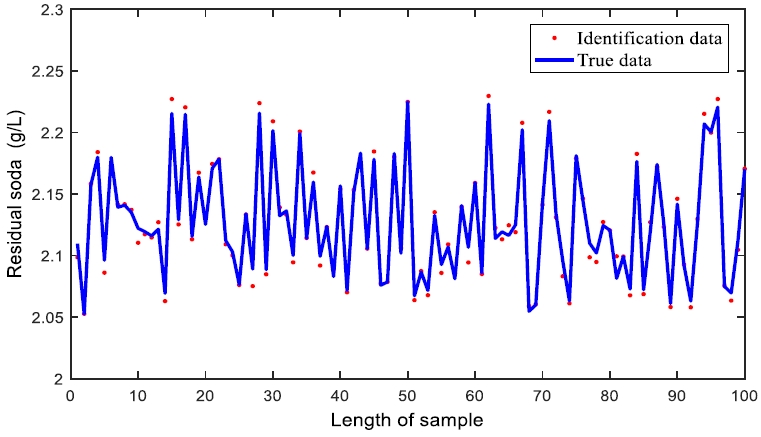
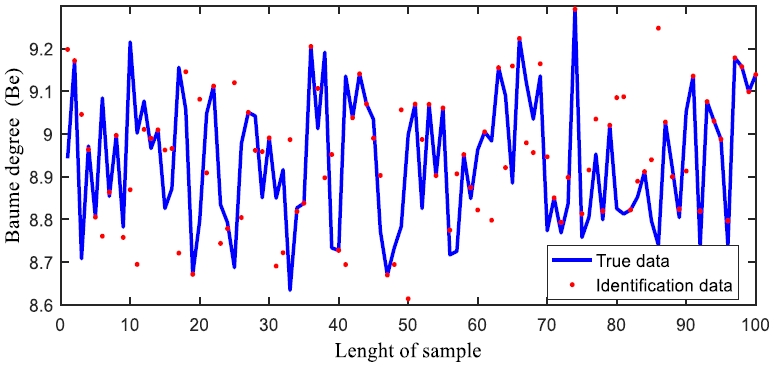
The learning curves are shown in Fig. 11 and Fig. 12. The true curve reflects the dynamics of the pulp washing process. The recognition curve obtained by the neural network reflects the good self-learning ability of the neural network.
4.1.3 Neural network stationary model identification
By continuously changing the values of the input variables, the NN dynamic model based on residual soda and Baumé degrees produces two stable data sets. Then two datasets were obtained respectively, 150 sample sets were used for the neural network, and 150 samples consisted of 30 actual production simulation data and 120 field data collected by DCS (distributed control system).
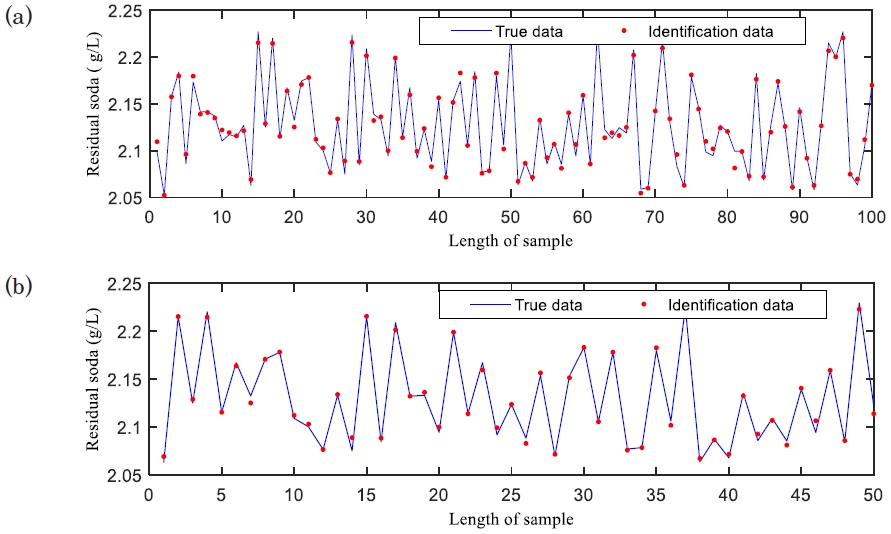
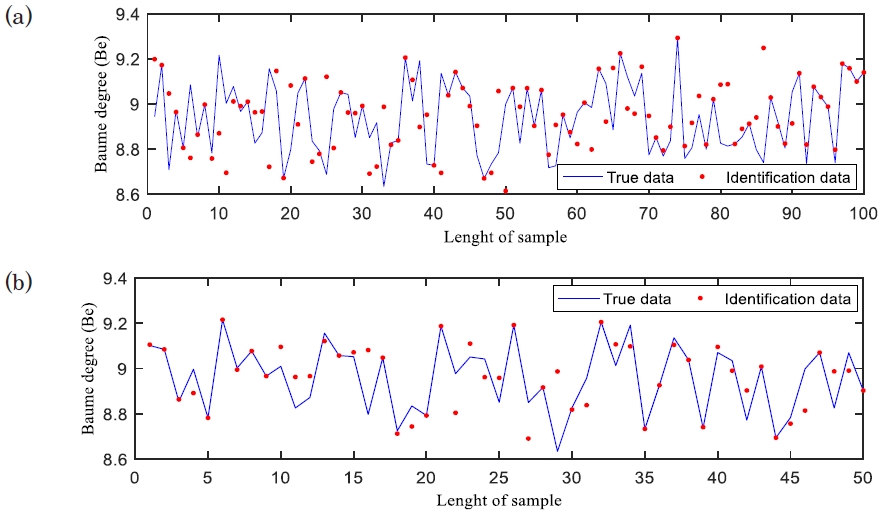
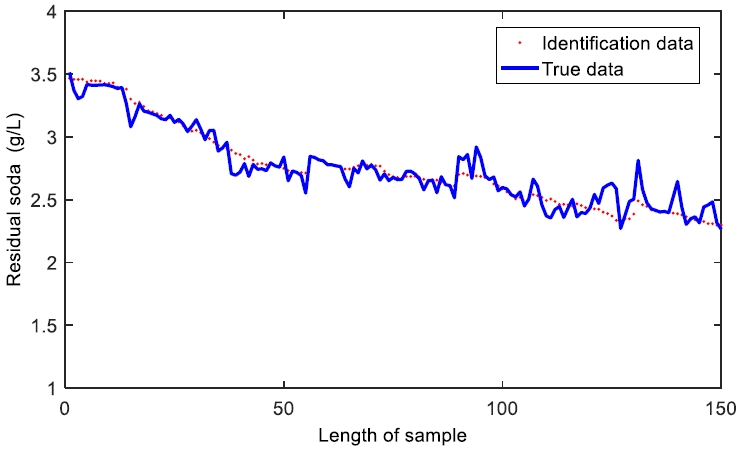
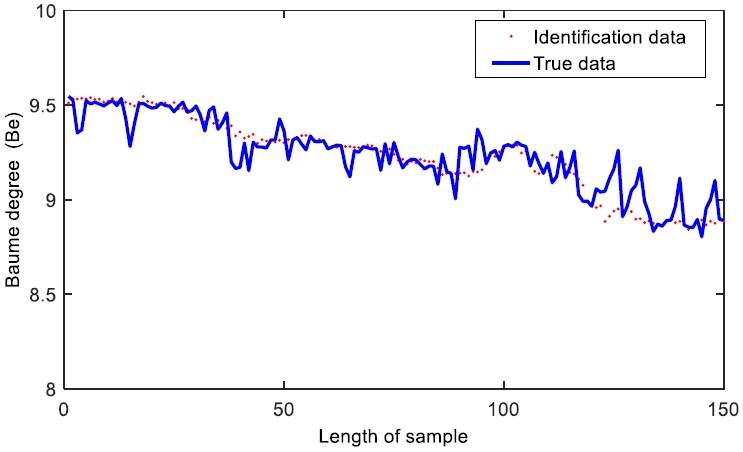
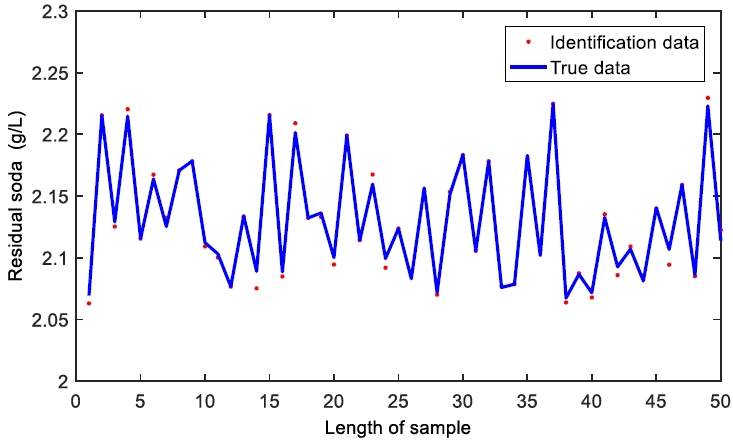
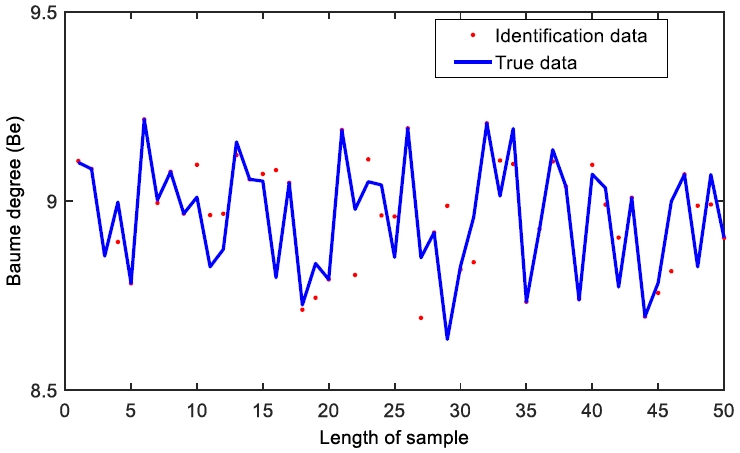
These datasets are used as samples to identify NN stable models. The 150 samples are divided into two parts: 100 sets of data are used to train the stable NN (including 30 sets of simulated samples). Another 50 sets of data are used to test the generalization ability of the trained NN. For the training of the NN steady-state model, the same three methods as above are used. The BP algorithm based on L-M optimization is found to be the best. The data learning curves generated after neural network training are shown in Fig. 13 and Fig. 14. This reflects the excellent functionality and robustness of the adopted BP neural network.
The generalization curves of the neural network are shown in Fig. 15 and Fig. 16. The results show that the L-M training function works effectively and accurately in data correction with good generalization performance.
4.1.4 Amendment of the soft sensor model
The model based on neural network established above is actually only considered the various input variables combined effect on Baumé degree and residual soda,[17] Therefore, the linear regression method is proposed to compensate the fitting error of neural network model, which can improve the accuracy of the model.
Assume
Where, Δx(k) is the difference between NN model data and actual data of residual soda and Baumé degree. x(k) denotes soft sensor value, x(0)(k) denotes actual test value. Where linear regression compensation model can establish as follows,
Where
Since the variance of the regression values may increase the variance of the regression coefficients or the matrix may be singular, the original data should be normalized to
where
After the transformation, Equation (6) can be described as
where
α can be obtained by least squares method. So the linear model for error compensation can be obtained.
In this paper, a novel soft perception modeling method based on the least-squares method is proposed. The least-squares fitting on the following 100 groups of neural network sample data were performed on MATLAB. The fitting results of residual soda and Baumé degree are in Equation (13).
Fitted value and prediction value of Baumé degree and residual soda can be obtained by neural network model and error compensation by linear regression, which can be described as Equation (14).
Where 1 ≤k≤n, denotes the fitted value, where k>n, it is the prediction value. is obtained by the NN model. described the error compensation of linear regression.
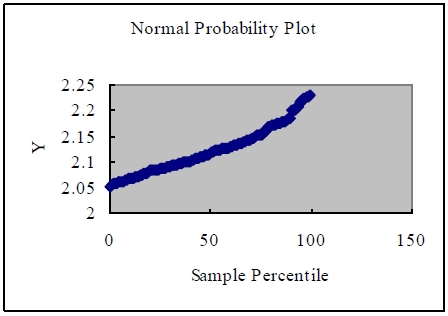
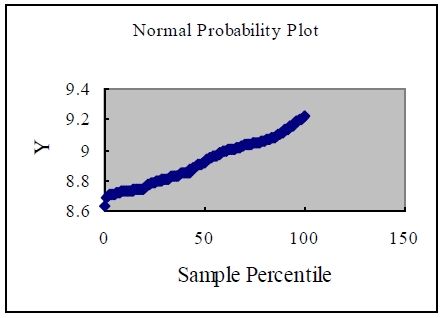
Testing of the linear fit degrees to residual soda and x1,x2,x3 by regression. The deviation of residual soda and x1,x2,x3 is shown in Fig. 17. Test of the linear fit degrees of Baumé degree and x1,x2,x3 are also made. The deviation of Baumé degree and x1,x2,x3 is shown in Fig. 18. Correspondingly, the sample curve is approximate to a straight line (Y represents the fitting value of residual soda and Baumé degree), the deviation is subject to a normal distribution.
4.2 Operation mode optimization of pulp washing process
4.2.1 Condition judgment
Residual alkali and black liquor Baumé degree reflect the working state of the pulp washing process. To control the dynamic process of pulp washing, the residual alkali and black liquor Baumé degree prediction model is used to judge the working state of pulp washing quality. The working condition index S is shown in Equation (15).
where, 1.923 and 7.59 are the target values of residual soda and Baumé degree of black liquor, k1, k2 are the weights, the values of k1 and k2 are generally 0.4 and 0.6. According to the calculated S value, the comprehensive operating condition index can be divided into four intervals: excellent, good, medium, and poor. If it is optimal, the current parameter is maintained, if not, adjust the operating parameters to optimize the model.
4.2.2 Optimization model of pulp washing process
In order to optimize the pulp washing process, a multi-objective optimization model with high quality, high yield, and low consumption was established. This target model can be specified in more detail in Equation (16).
The difference between the amount of washing liquid and the amount of slurry after washing is a constant, that is DF (dilution factor), according to the actual process requirements, 0≤DF≤6(M=6). The purpose of pulp washing optimization control is not only to ensure pulp washing quality but also to reduce energy consumption. The most important resource is water, so reducing water consumption means reducing energy consumption. In the formula F(DF) is the consumption cost, which is related to the dilution coefficient DF. According to the principle of pulp washing system engineering, the material balance of pulp washing and evaporation is analyzed, and the model of DF and washing water is established.
x1max, x2max is the maximum of inlet pulp consistency and inlet pulp flow. Y′(x1,x2) is the deviation of the pulp output, C(x3) is the water consumption.
4.2.3 Solution of the optimization model
Structuring an evaluation function, transform the multi-objective optimization problem[18] into a single objective, as detailed in Equation (17).
where ω1∈[0,1],ω2∈[0,1],ω3∈[0,1], and ω1+ω2+ω3=1. It reflects the importance of these objectives.
When operation in a paper mill, the parameters are designed in Equation (18).
The optimization model is a nonlinear multi-objective optimization problem with linear constraints, and the ant colony algorithm can be regarded as a distributed multi-agent system.[19] In this paper, the ant colony optimization algorithm is used for optimization. The optimal operating mode is obtained through 10-step iterations.
An unconstrained optimization model based on the penalty function is established. The corresponding nonlinear unconstrained optimization model for the pulp washing process is described in Equation (19).
where xi is an infeasible point, min[0,gj(xi)]=0. where xi is a feasible point, min[0,gj(xi)]=gj(xi).
The penalty factor σ will increase with the number of in-feasible solutions. E* is the expected value of the water consumption. Y* is the expected value of the pulp output.
Equation (19) is an unconstrained minimization problem. It expresses the constraints of the model Equation (16) in the objective function in the form of a penalty function.[20] The constrained problem can be transformed into an unconstrained problem by optimizing the model with a penalty function. It shows that this method can find the optimal dilution ratio, reduce consumption, and bring greater economic benefits to pulp and paper enterprises.
Therefore, the network state equation for nonlinear programming is constructed as follows.
The calculation process of the dynamic equation is as follows.
Optimal pulp washing aims to identify an optimal plan that minimizes system production costs over some time while meeting individual unit load requirements, physical and operational constraints. Because the pulp washing process is a nonlinear, large-scale, non-convex, discrete, and constrained mixed-integer combinatorial optimization problem, it is difficult to find the theoretical optimal solution for pulp washing, but it has attracted the attention of domestic and foreign enterprises. Economic benefits can be achieved by using optimized pulp washing. Since the ACO algorithm can only solve problems without constraints, some corresponding techniques for dealing with equality and inequality constraints have been developed, i.e. restricting the states that violate constraints, such as the minimum DF, etc., the deviation of pulp production and water consumption according to Additional penalty item processing. The results of numerical calculation examples show that the proposed algorithm is feasible and usable.
5. Conclusions
Pulp washing is a complex physical process with long time delays and non-linear characteristics. The key is to maintain a balance between the amount of washing water used and the required pulp cleanliness. In order to solve the optimization control problem of the washing process, a smooth optimization model of pulp washing is studied in this paper. Soft sensing technology has been successfully operated in a paper mill in Shandong and obtained good control of residual alkali and Baumé degree. When the prediction error is within a certain acceptable range, the hit rate of residual soda is 84.8171%, and the hit rate of Baumé is 76.9893%. The soft perception technology proposed in this paper has the advantages of strong generalization ability, high precision, fast speed, and strong adaptability. This results in satisfactory pulp washing performance. The amount of pulp should be greatly increased, and the consumption of hot water should be reduced to the lower limit. The total cost of the pulp washing process is reduced, and it has certain economic benefits for pulping enterprises. Through optimizing the subsystem, engineers can be provided with a recommended set of optimal operating parameters (including pulp consistency, pulp flow, and hot water flow), thus increasing the flexibility of pulp washing schedules.
