

1. Introduction
Tissue products can be classified as toilet tissue, facial tissue, napkins, paper towels, and away-from-home products. Among them, facial tissue is considered a high-value product. Global economic growth and improved quality of life lead consumers to use tissue products on the basis of their proper function and quality. Thus, the consumption of facial tissue is increasing continuously.
Softness is one of the most important factors influencing consumers’ product selection and the quality of tissue products. In addition, softness is key attribute of facial tissue. Therefore, to improve the quality of facial tissue and ensure high marketability, methods to evaluate the softness of facial tissue products are critical. However, previous works related to the development of physical test methods for softness have commonly focused on bathroom tissue. That is, very few studies to develop physical test methods for facial tissue products have been reported.1)
Meanwhile, softness evaluation of tissue products is mainly conducted using sensory panel tests (SPTs).2) However, the panelists’ evaluation is difficult to present clearly as an objective indicator because of psychological effects. Hence, researchers have attempted to develop physical test methods that can be used to predict the softness of tissue products.
According to Hollmark, softness can be considered to consist of bulk softness and surface softness.3) He also reported the results of experiments showing a good correlation between the subjective softness and the tensile stiffness of materials. In addition, tensile stiffness has been shown to be well correlated with bulk softness.4-8)
Tensile stiffness is commonly obtained from stress-strain curves. However, obtaining such a stress-strain curve for tissue paper is extremely difficult because a thickness value is necessary to calculate the stress; accurately determining the thickness of tissue paper is not straightforward because of its creped and embossed structure.4)
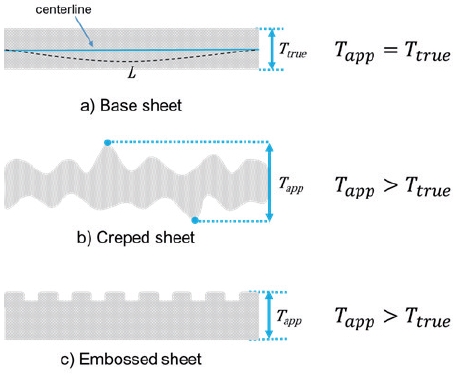
As shown in Fig. 1, sample thickness can be defined two ways. The true thickness (Ttrue) is defined as the sample’s cross-sectional area divided by its centerline length. The apparent thickness (Tapp) is defined as the distance between the highest and the lowest points in the solid region. The figure shows that the apparent thickness should be greater than the true thickness, making the apparent density lower than the true density. The thickness of the tissue depends on the papermaking process, such as drying, creping, embossing, and calendaring.6,7,9,10) The true and apparent thicknesses of facial tissue products, in particular, are different because creping is required. Thus, the problem of determining thickness to obtain a stress-strain curve from a tensile test can be easily circumvented by using a load-elongation curve.
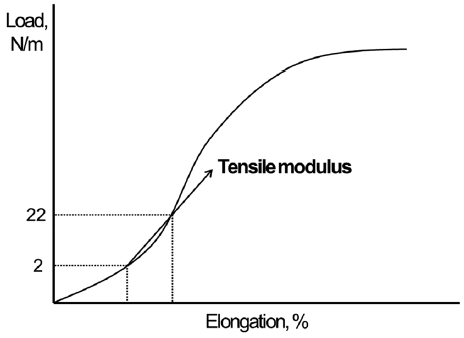
The elastic region of the load-elongation curve of tissue paper, which is used to determine the tensile stiffness (defined as the initial slope in the curve), is difficult to observe. One proposed solution to this problem is to extract the tensile modulus as the slope between two points in the curve.4-7) Other authors have used two points corresponding to loads of 2 N/m and 22 N/m to determine the tensile modulus.8)Fig. 2 illustrates this method of obtaining the tensile modulus from the load-elongation curve.
Physical properties such as tensile modulus are dynamic. Thus, the test results depend on the testing conditions. Ramasubramanian9) reported that, in the case of tensile modulus determination, the sample size, span length, and the cross-head speed influenced the results.
The aim of the present study is to analyze testing conditions affecting the determination of the tensile modulus of facial tissue. These results can be used in the development of a physical measurement method for the softness parameter of facial tissue. In this study, facial tissue products were selected as samples and the tensile modulus was determined under different testing conditions for test span gauge length, sample width, elongation speed, and rate of elongation.
2. Materials and Methods
2.1 Materials
Four commercial facial tissue samples were tested for tensile modulus. Table 1 lists the samples and some of their physical properties. The facial tissue samples were conditioned for more than 48 h at 23±1℃ and a relative humidity of 50±2%, in accordance with standard testing method ISO 187.
2.2 Tensile modulus measurement
A tensile modulus was measured using a tensile tester machine (Criterion® 41, MTS, USA). Tensile testing was performed under eight test conditions with different test span gauge lengths, sample widths, elongation speeds, and rates of elongation. Table 2 shows the testing conditions used in the tensile tests.
Table 2.
Conditions for tensile testing
| Condition no. | Length, mm | Width, mm | Elongation speed, mm/min | Rate of elongation, %/min |
|---|---|---|---|---|
| 1 | 50 | 50 | 7.5 | 15 |
| 2 | 50 | 50 | 12.5 | 25 |
| 3 | 50 | 50 | 25 | 50 |
| 4 | 50 | 50 | 50 | 100 |
| 5 | 50 | 25 | 12.5 | 25 |
| 6 | 75 | 25 | 12.5 | 16 |
| 7 | 75 | 50 | 12.5 | 16 |
| 8 | 75 | 25 | 18.8 | 25 |
The tensile modulus was calculated from the load-elongation curve; specifically, the slope between the loads at 2 N/m and 22 N/m was determined as the tensile modulus. Each sample was tested 10 times in the machine direction (MD) and cross direction (CD). The results are expressed as geometric mean (GM) values. Each GM value was calculated as the square root of the mean MD value multiplied by the mean CD value.
2.3 Statistical analysis
Statistical analysis was performed using the JMP software (SAS Institute, Cary, NC, USA). Analysis of variance (ANOVA) was carried out using a significance level of 5%. The tested hypotheses were the following:
H0: All averages are equal, there is no significant difference between test conditions.
H1: At least one of the averages is statistically different from the other test conditions.
When the ANOVA showed significant differences among the test conditions, the Tukey-Kramer HSD test (p< 0.05) was applied.
3. Results and Discussion
Tensile testing was performed for eight test conditions of different test span gauge lengths, sample widths, elongation speeds, and rates of elongation to determine the factors affecting tensile modulus measurements. The tensile modulus was determined as the slope between loads of 2 N/m and 22 N/m on the load-elongation curve. The test results were shown in Fig. 3.
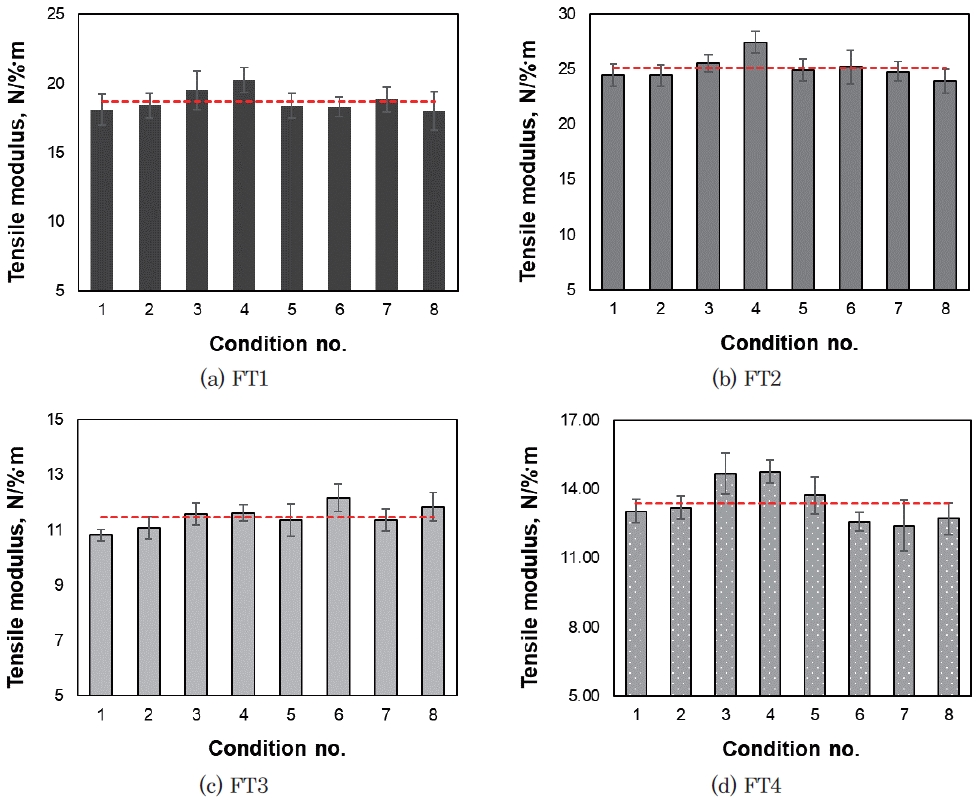
The average tensile modulus for facial tissue samples FT1-FT4 were 18.7, 25.1, 11.5, and 13.2 N/%·m, respectively.
Fig. 3(a) showed the results for sample FT1. Conditions 3 and 4 gave much higher tensile modulus values than the other conditions; the highest value was measured under condition 4, and the lowest value was measured under condition 8. Fig. 3(b) showed the results of sample FT2. Similar to the results for FT1, conditions 3 and 4 gave much higher tensile modulus values than the other conditions. The highest value was also obtained under condition 4, and the lowest value was obtained under condition 8. Fig. 3(c) showed the results for sample FT3. Again, conditions 3 and 4 resulted in higher values than the average value. However, the results obtained under conditions 3 and 4 were only slightly higher than the values obtained under the other conditions. Unlike the other samples, sample FT3 showed a high value obtained under conditions 6 and 8, and the lowest value was obtained under condition 1. Fig. 3(d) showed the results of FT4. The trends for this sample were similar to those for FT1 and FT2, and conditions 3 and 4 resulted in much higher values than the other conditions. The highest value was obtained under condition 4, and the lowest value was obtained under condition 7.
ANOVA was performed for all test conditions to determine whether these differences were statistically significant. All four samples were determined to have a significant difference in the tensile modulus measurement values obtained under the eight test conditions. Because the ANOVA results showed significant differences among the test conditions, the Tukey-Kramer HSD test (p<0.05) was performed to compare all pairs.
3.1 Comparisons of tensile modulus at the same gauge length and width
For conditions 1-4, the measurements were conducted for a span gauge of 50 mm and a sample width of 50 mm and the elongation speed and rate of elongation were varied. A comparison of all combinations of these conditions revealed that conditions 1 and 4 had significant differences in common among the four conditions. In addition, conditions 2 and 4 showed a significant difference in all three samples except FT1. For FT3 and FT4, the difference between conditions 1 and 3 was also significant.
The results showed that the tensile modulus relatively changed according to the elongation speed or rate of elongation during tensile testing at the same gauge length and width. In particular, the difference between the measurements under rates of elongation of less than 25% and 100% is clearly significant. Interestingly, the significance of the difference in the results varied among samples; however, the tensile modulus was found to increase with increasing elongation speed and rate of elongation.
3.2 Comparisons for tensile modulus at the same elongation speed
Conditions 2, 5, 6, and 7 were all tested at an elongation speed of 12.5 mm/min. The gauge length, width, and rate of elongation were varied. A comparison of all pairs of these conditions revealed that FT1 and FT2 differed significantly. However, in the case of FT3, condition 6 showed a significant difference from all other conditions. For FT4, condition 5 was significantly different compared with conditions 6 and 7. Thus, when the elongation speed was the same, the tensile modulus could be affected by the gauge length, width, or rate of elongation. However, no clear trend of the tensile modulus was observed.
3.3 Comparisons for tensile modulus at the same rate of elongation
Conditions 2, 5, and 8 had the same rate of elongation, and the gauge length, width, and elongation speed were varied. FT1 and FT2 showed no significant differences in all pair comparisons under these conditions at the same rate of elongation. For FT3, conditions 2 and 8 showed a significant difference; for FT4, condition 8 showed significant differences from the other conditions.
Condition 1 was tested at a rate of elongation of 15%/min, and conditions 6 and 7 were tested at 16%/min. All pair comparisons between these three conditions showed that only FT3 exhibited a significant difference between conditions 6 and 7.
Although the tensile modulus did not show clear trend at the same rate of elongation, it might still be affected by gauge length, width, or elongation speed. In addition, this effect might be small at lower elongation rates.
3.4 Determination of testing conditions for measurement of the tensile modulus
This paper provided basic data and trends that could be identified through a clear review of the results. On the basis of the analysis results, we recommended the conditions in Table 3 for the determination of the tensile modulus of facial tissue.
Table 3.
Testing conditions for the determination of the tensile modulus of tissue products
| Condition | Facial tissue (this study) | Bathroom tissue (Park, 2018)11) | Towel* (Ramasubramanian, 2002)9) |
|---|---|---|---|
| Length, mm | 50 | 75 | 180 |
| Width, mm | 25 or 50 | 25 | 25.4 |
| Rate of elongation, %/min | ≤25 | 25 | 14.2 |
The gauge length showed a significant difference in some samples for tensile modulus determination but did not show a consistent trend. However, these results suggested that the gauge length should be 50 mm when determining the tensile modulus of facial tissue. Because facial tissue products are folded into a box when packaged as a final product, clampable specimens with a gauge length of 75 mm may be difficult to obtain, depending on how the sheet is folded.
The effect of sample width was that the difference between conditions 2 and 5 was insignificant in all samples and that, under conditions 6 and 7, only FT3 showed a significant difference. The sample width was assumed to have no effect on the tensile modulus of facial tissue under the same elongation condition. The condition 6 results for FT3 showed a different trend compared with other samples. Therefore, we expected that a clear result could be obtained by retesting FT3 or adding additional samples.
The elongation condition was expressed as the rate of elongation. At elongation rates greater than 50%/min, not only was the tensile modulus value higher than the average but the elongation speed was too fast for the initial slope between 2 and 22 N/m to be measured accurately. Therefore, the results of the present study suggested that the rate of elongation should be less than 25%/min.
Table 3 also showed the tensile testing test conditions for bathroom tissue and towels. The recommended conditions for the determination of the tensile modulus of facial tissue were similar to the other conditions. The suggested sample widths and rates of elongation were also similar. A difference was observed in the appropriate gauge length according to the tissue product type. In conclusion, we proposed that the testing conditions used to evaluate the softness of facial tissue products should differ from those used for other tissue products.
4. Conclusions
In this study, we analyzed the testing condition factors that affect the determination of the tensile modulus, which is one of the physical properties used to characterize bulk softness.
Facial tissue products were selected as samples, and the tensile modulus was determined under different testing conditions in terms of the test span gauge length, sample width, elongation speed, and rate of elongation.
The gauge length showed a significant difference in some samples for tensile modulus determination but did not show a consistent trend. However, this study suggested that the gauge length should be 50 mm when determining the tensile modulus of facial tissue because of the folded sheets packaged in boxes. The sample width could be reasonably assumed to have no effect on the tensile modulus of facial tissue under the same elongation conditions. Therefore, in this study, a sample width of either 25 or 50 mm was considered suitable for determining tensile modulus. The rate of elongation was found to be more stable and accurate for the determination of the tensile modulus at elongation rates less than 25%/min.
The testing conditions in this work were similar to the tensile testing conditions used for other tissue products but with a clear difference in gauge length. Consequently, we proposed that the testing conditions used to evaluate the softness of facial tissue products should differ from those used for other tissue products.
