

1. Introduction
Starch is a polysaccharide consisting of glucose units and biodegradable polymer produced by plants. Next, to cellulose, starch is the most abundant natural polysaccharide. Starch is made up of glucose units and is deposited in the seeds, tubers, roots, and stem pith of plants.1) The starches from various agricultural products, such as corn, potato, wheat, and cassava, have been considered in terms of their physicochemical properties. Starch has unique functionalities according to its source.2) Therefore, identification of starch properties is required to obtain the desired functionality in relation to end-use.
Various industries use starch as the main product in their applications. The paper industries in the United States and Europe are the largest consumers of dried starch. Such industries use starch in the wet-end process when paper sheet is formed, for internal sizing and coating.3) Starch is also widely used in the corrugated board and packaging industries as an adhesive. In 1930, the Stein-Hall process was introduced as the first primary commercial process for producing starch adhesives.4) The process consists to two phases: in the first phase, the starch is cooked to form a gelatinized starch; in the second phase, the gelatinized starch is mixed with borax to form the finished adhesive. Starch has a high hydrogen-bonding capability owing to the large of amount of glucosidic and hydroxyl groups.5) Consequently, the water resistance of native starch adhesives is poor. Therefore, to achieve a particular application, native starch may be subjected to subsequent chemical and physical modifications.
Many methods have been developed to characterize starch properties, e.g., composition, swelling, solubility, morphology, gelatinization, retrogradation, and rheology. Amylose and amylopectin compositions vary across starches from different sources; this affects their crystallinity and paste behavior. Morphological characteristics such as variations in the size and shape of starch granules can be observed by scanning electron microscope (SEM).6) The various granule sizes and shapes also differ significantly across sources. Moreover, different compositions exhibit different enthalpies of gelatinization. The gelatinization and swelling properties are controlled by the ratio of amylose and amylopectin, the molecular structure of amylopectin, and the ratio of crystalline to amorphous. Temperature also impacts the viscosity of starch.7) Moisture sorption capacity is a measure of the moisture sensitivity material. It relates to swelling and hydration capacity. Salleh et al. (2015) reported that the higher moisture sorption gave the higher swelling and hydration capacity. These properties are suitable for starch to be used as a binder. Hausner ratio and Carr index are considered as indirect measurements of powder flowability. Hausner ratio and Carr index values below 1.55 and 50% indicated good flow characteristic.8)
This study was designed to investigate the composition and rheological characteristics of starches from several agricultural sources, i.e., corn, potato, wheat, and tapioca. Further, the studied properties were used to develop a formulation composition having sufficient strength for starch-based adhesive.
2. Materials and Methods
2.1 Raw materials
Commercially available native starches, i.e., corn, potato, wheat, and tapioca, were purchased from a local market in Seoul, Korea. These starches were sifted using an automatic vibration sieve shaker to remove impurities. The desired amount of starch was obtained and stored for further experiments. Chemical reagents of analytical grade were used for determining the starch, amylose, and amylopectin contents.
2.2 Physicochemical properties of starch
The physicochemical properties, i.e., starch content, amylose and amylopectin contents, pH, moisture content, moisture sorption capacity, swelling capacity, hydration capacity, bulk and tapped densities, Carr index, Hausner ratio, and ash content, of the starches were determined for each sample.8)
Starch content was determined according to Nielsen.9) About 2 g of oven-dried starch was dissolved in 2 mL distilled water and 2.7 mL of 72% perchloric acid. The solution was stirred for 10 minutes and adjusted to 50 mL total solution by adding distilled water. The supernatant was carefully transferred to a 100-mL beaker followed by the addition of 6 mL distilled water, a drop of phenolphthalein, and a few drops of 6 N sodium hydroxide (NaOH). Titration was performed by adding acetic acid until the pink color was lost. Then, 0.5 mL of 10% potassium iodide (KI) and 5 mL of 0.01 N potassium iodate (KIO3) were added to the solution to obtain a bluish color. This was then analyzed using a UV-vis spectrophotometer at a wavelength of 650 nm. Linear regression was used to determine the starch content.
Amylose and amylopectin contents were determined according to Riley et al.10) About 5 g of starch was placed in an extraction thimble and extracted using n-hexane to remove the lipid content. After the extraction process was complete, the thimble and lipid-free starch were air-dried for 12 h before the sample was removed from the thimble and dried at 30℃ for 24 h. Approximately 20 mg of lipid-free starch was dissolved in 8 mL of 90% dimethyl sulfoxide, shaken for 2 min, and then heated at 85℃ for 15 min. The solution was then diluted by adding 1 mL of the solution into 40 mL of distilled water and 5 mL of iodine. The solution was shaken and left for 15 min. The absorbance was analyzed using a UV-vis spectrophotometer at a wavelength of 600 nm. Linear regression was used to determine the amylose and amylopectin contents of the starches.
Ash content was measured according to the National Food Standard Safety Standard.11) The moisture content was determined by drying about 5 g of sample at 60℃ until a constant weight was achieved. pH was determined by diluting 1 g of starch into 100 mL of distilled water, followed by measurement using an electronic pH meter.
In determining moisture sorption capacity, about 2 g of air-dried starch (W) was weighed into a petri dish and placed in a desiccator along with 800 mL of distilled water divided into 250-mL glass beakers. The samples were exposed for five days, after which the amount of absorbed water (Wa) was calculated. Then, the moisture sorption capacity was determined as12)
In determining swelling capacity, about 0.1 g of air-dried starch (W) was dispersed in 100 mL of distilled water and left for 1 hr. The swollen polymer was filtered using Whatman filter paper No. 4. The filtrate was then weighed (Wf) and the swelling capacity determined as13)
About 1 g of starch (W) was dispersed in 10 mL of distilled water and shaken for 2 hr. The mixture was centrifuged at ~2,500 g for 8 min. The resulting pellet was weighed (Wp) and the hydration capacity was calculated as13)
About 50 g of starch (W) was poured into a 100-mL graduated cylinder. The volume occupied by the sample was determined (V). The sample was tapped until no further change in volume was observed (Vt). The bulk and tapped densities were calculated as8)
Using the above-obtained values, the compressibility index and Hausner ratio were calculated as14)
2.3 Pasting properties of starch
Swelling power was calculated for each sample. A 2% (w/v) starch dispersion was heated in a shaking water bath at five different temperatures, i.e. 55, 65, 75, 85, and 95℃, for 30 min. The samples were cooled and then centrifuged at ~2,000 rpm for 30 min. The supernatant was removed and the gel was dried at 103℃ until constant weight (Wg) was achieved. The swelling power was calculated as8)
A starch paste with a 20% solid content was cooked at a temperature of 80℃ for 30 minutes. Then, the paste was held constant at 65℃. The viscosity was measured using a Brookfield viscometer model HBDV-I+ using spindle number 7, with the measurement performed within 60 seconds.
2.4 Peel resistance of starch paste
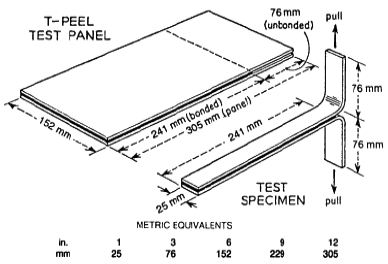
A strength test of the adhesive bond was carried out according to method ASTM D1876-01 as shown in Fig. 1.15) This procedure is intended to determine the relative peel resistance of adhesive bonds between flexible adherends (i.e., wallpaper) using a T-type specimen in a tensile tester machine (Criterion® Model 41, MTS, USA). This was expressed as the peeling load (N).
3. Results and Discussion
3.1 Physicochemical properties of starch
The physicochemical properties of the starches from several agricultural sources are shown in Table 1. The starch contents for corn, potato, wheat, and tapioca were in the range 81.3-84.6%. The amylose contents of the starches varied with agricultural source; for the corn, potato, wheat, and tapioca starches, the amylose contents were 26.8, 27.6, 22.6, and 17.3%, respectively. The highest amylopectin content was found in the tapioca starch (82.7%), followed by the wheat, corn, and potato starches (77.4, 73.2, and 72.4%, respectively). In a previous study, Singh et al. (2003) reported that the amylose content of starch granules varies with botanical source and is affected by climatic conditions and soil type during growth.5) Further, the amylose content of corn starch varied from 14 to 27%, that of potato starch from 20 to 30%, that of wheat starch from 18 to 30%, and that of tapioca starch from 17 to 20%. The proportions of amylose and amylopectin contribute to the functional properties of a starch.
Table 1.
Basic properties of the studied starches
The purity of a starch is indicated by its ash content. It was found that corn starch had the lowest amount of ash (0.17%), followed by the tapioca, potato, and wheat starches (0.29, 0.31, and 0.99%, respectively). Starch manufacturing process and chemical that used takes place in this variety of ash content. The moisture contents of the starches were similar across all the sources (11.6-12.6%). For wheat starch, a moisture content of around 13% has been reported as acceptable for commercial purposes.1) Moisture content is reported to influence moisture sorption capacity. To determine the acidity of the starches, the pH of each sample was measured, indicating similar values for the various starches (6.23-6.71).
Tapioca showed the highest swelling capacity (13.6%), followed by potato, wheat, and corn (12.4, 11.1, and 10.5%, respectively). The same pattern was found for hydration capacity. The swelling and hydration capacities relate to the proteinaceous materials found in the starch. It has been reported that swelling is limited owing to the phospholipids present in starch exhibiting a tendency to form complexes with amylose and long branched chains of amylopectin.16)
The bulk and tapped densities were determined to calculate the Carr index and Hausner ratio. The bulk densities of the various starches were in the range 0.35-0.49 g/mL, whereas the tapped densities were 0.62-0.74 g/mL. The Carr index was found to be highest for tapioca (46.15%), followed by wheat, potato, and corn starch (41.9, 34.7, and 21.0%, respectively). These properties correlate to the flowability of the starch granules and reflect the viscosity of the starch paste. Higher Carr indexes and Hausner ratios indicate cohesive behavior and less free flow in a liquid medium owing to the higher viscosity of the paste.8)
3.2 Pasting properties of starch
Table 2 shows the swelling properties of the various starches at different temperatures. Tapioca starch showed the highest value, followed by wheat, potato, and then corn. The results show a correlation with the swelling and hydration capacities. It is essential to understand swelling power as it provides information on how the characteristics of a starch affect its pasting properties. Initially, the starch granules were insoluble in water at room temperature. When a starch water suspension was heated beyond the pasting temperature, the granules absorb water, the crystalline structure is disrupted, and water molecules become linked by hydrogen bonding to the exposed hydroxyl group of amylose and amylopectin.17) As such, the granules swell to many times their standard size. This results in a viscose and colloidal mass known as starch paste.
Table 2.
Swelling power of the studied starches
| Samples | Temperature, °C | ||||
|---|---|---|---|---|---|
| 55 | 65 | 75 | 85 | 95 | |
| Corn, g/g | 7.13 | 9.24 | 10.82 | 12.69 | 21.88 |
| Potato, g/g | 7.45 | 9.89 | 11.07 | 13.42 | 23.56 |
| Wheat, g/g | 7.48 | 9.49 | 12.11 | 13.93 | 23.64 |
| Tapioca, g/g | 9.22 | 11.53 | 13.47 | 17.66 | 28.14 |
The starch paste was prepared in a suspension with a concentration of 20%. Based on their measured basic properties, wheat starch (WS) and tapioca starch (TS) were selected for preparation into pastes. The starch pastes were blended under specific ratios i.e., WS100:TS0, WS85:TS15, WS75:TS25, WS50:TS50, and WS0:TS100. The resulting viscosities are shown in Fig. 2.
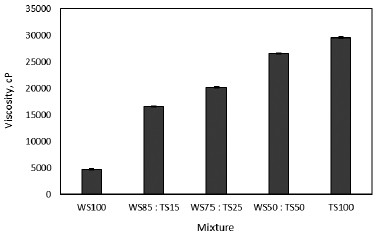
Starch exhibits a unique viscosity profile with changes in temperature, concentration, and shear rate; consequently, a rotational viscometer or dynamic rheometer should be used to determine the viscoelastic properties of starch. As shown in Fig. 2, of all mixtures, TS showed the highest viscosity level, whereas WS showed the lowest level of viscosity. By adding increasing amounts of TS to WS, the viscosity level of the starch paste increased. This occurred because the amylopectin content of TS was higher than that of WS. The phosphate monoester bound covalently to the amylopectin fraction of starch increased paste clarity and viscosity.5) Starch also can exhibit low viscosity after reaching a maximum level. The profile is influenced by the initial concentration of starch paste.
3.3 Peel resistance of starch paste
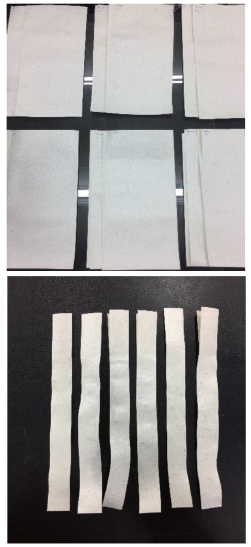
Peel resistance was assessed to demonstrate the adhesive-related properties of the starches. The paste was applied to pieces of wallpaper that were then stuck to each other and left until the paste had dried. The test specimens were cut into strips of 241 mm (length) and 25 mm (width), as shown in Fig. 3. The maximum load was obtained at a pull position of 76 mm.
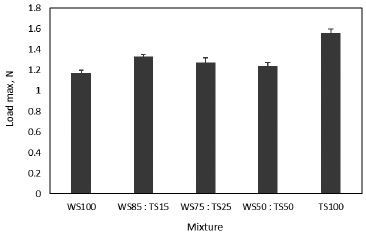
From Fig. 4, TS exhibited good peel resistance compared with the other mixtures. It also appears that adding TS to the mixture resulted in strong bonding, as compared with WS only. It occurred when a paste is placed at room temperature, the reassociation of amylose may cause the retrogradation, but amylopectin remains stable.18) Since TS contained the highest level of amylopectin, the strong bonding between these molecules may have resulted in the high peel resistance.
4. Conclusions
The basic properties of starches from various agricultural sources differ significantly. These differences influence the pasting properties and peel resistance of starches paste. By choosing the right temperature, concentration, and type of starch, a desired functionality for a particular application might be achieved. Among the starches studied here, tapioca contained the highest amount of amylopectin, which affected the properties of swelling, hydration capacity, and viscosity. Such a starch could have application as a wallpaper paste since the peel resistance was significantly higher than that of the other starches studied.
