

1. Introduction
The pulping and papermaking processes are typical high energy intensive in forestry production sectors. It is also one of the important components of the manufacturing industry in China, especially for the pulp and paper industry (PPI). According to Food and Agricultural Organization of the United Nations, China manufactured 9.2% and 25.5% of global pulp production and paper & paperboard in 2018, respectively.1) According to Zheng,2) China’s PPI energy use was equivalent to 60% of Finnish industrial energy use, 40% of the Swedish industrial energy use, and 10% of the U.S. industrial energy use. Although its energy intensity has been declined dramatically during past decades as improvement of energy efficiency, further capabilities for reducing energy use in the coming decade was still demonstrated.3)
Energy conservation and pollution reduction of the industry have become the focus of China’s national development strategy. Energy efficiency improvement has received increasing attention in many industrial sectors because of its importance in the pursuit of low energy consumption and increased economic competitiveness. Many studies have been conducted to reduce PPI’s energy use from different perspective. In one of our prior works,4) potential measures to improve energy efficiency in China’s PPI were evaluated using bottom-up method. Peng et al. identified the available energy saving and CO2 emission mitigation potentials in the Chinese PPI with scenario analysis.5) Lin and Zheng identified 44% to 65% of energy saving potential in China’s paper industry during the period 1990-2013.6) Lin et al. summarized energy saving potential of 118 pulp and paper factories from 2009 to 2013 by energy audits in Chinese Taiwan.7) Besides, we also identified energy saving potential of a paper mill in China through energy audit at the factory level.8) Fleiter et al. analyzed energy saving potential and CO2 emission of the German paper industry comprehensively.9) Pandey and Prakash evaluated annual energy saving potential of a typical paper mill in India.10) The feasibility of energy reduction in the linerboard manufacturing process by ground calcium carbonate addition was studied by Kang and Seo,11) and Han et al.12) respectively. The drying energy saving measure for old corrugated container with application of wood flour and starch were conducted by Seo et al.13,14) However, it is usually hard to evaluate energy efficiency opportunities for operators because of differences in technological know-how at the factory level.15) It also depends on detailed onsite measurements from the energy surveyors and their field experience.
To assess energy savings and carbon emissions reduction from paper mill, the analysis of a typical packing paper mill based on the Energy Efficiency Assessment and Greenhouse Gas Emission Reduction (EAGER) tool for PPI has been presented in this study. Energy savings opportunities for the case mill have also been identified and presented.
2. Materials and Methods
A simple and user-friendly tool, EAGER for PPI,16) was used to analyze energy savings in paper mill that cover all the processes of pulping and papermaking based on both technical and economic aspects. The tool was developed by one of the authors’ colleague from Lawrence Berkeley National Laboratory and reviewed by the author.
EAGER tool for PPI has been implemented with spreadsheet software (MS Excel) making use of Visual Basic. It was composed by six functional sheets. They are instructions sheet, general plant input sheet, energy efficiency measures sheet, measure description sheet, results by measure sheet, and total results sheet.
In the general plant input sheet, the user is requested to input the basic information about the investigated paper mill, e.g. the operational boundary, annual production and energy data, as well as energy prices etc. It should note that the default CO2 conversion factors are supposed to use unless the measured factors provided. In the energy efficiency measures sheet, 45 energy efficiency technologies are listed as regarding to typical electricity and fuel saving, typical capital cost, and change in operation and maintenance (O&M) cost. It is required to enter the potential application rate of each measure within the operational boundary if implemented the selected EE measure. This is usually determined by interview with managers and decision makers from the investigated paper mill. A brief description of each measure can be found at the measure description sheet. For more information about these basic data, please refer to the literature.16)
After completed aforementioned sheets, the estimates for energy savings (i.e. electricity, fuel, and final energy), CO2 emission reduction, cost, and simple payback period for each measure will be calculated and shown separately in the results by measure sheet. Furthermore, the accumulated energy savings, CO2 emission reduction, cost, and simple payback period are given in the total results sheet to estimate total saving potential. Based on the results, the manager or decision makers could prioritize the selected energy efficiency measures.
EAGER tool for PPI is designed to evaluate the impact of selected energy efficiency measures for the pulp and paper industry by choosing the measures that the energy or manager would like to evaluate for the mill’s potential use. Accordingly, the decision makers could decide whether introduce and invest related measures or not in their pulp and paper mill.
3. Results and Discussion
3.1 Operational boundary and energy use
In this work, a typical packing paper mill was chosen as the case mill. Fig. 1 showed the operational boundary of the mill. As can be seen, linerboard and corrugated paper were produced from recycled paper (old corrugated container, OCC) and market pulp (softwood bleached kraft pulp, SwBKP). The market pulp with 10-20% of ratio was used to make linerboard mixed with recycled paper pulp. After re-pulping of recycled paper and market pulp, the pulp was sent to the stock preparation section with 4-5% of fiber concentration. Then the wet corrugated paper or linerboard was formed in the forming section of paper machine, followed by dewatering in the pressing section and drying section continuously before achieved the desired dry solid content. In addition, the paper mill installed four coal-fired boilers with 465 t/h of steam generation. The total electricity generation capacity of CHP (combined heat and power) was 55 MW.
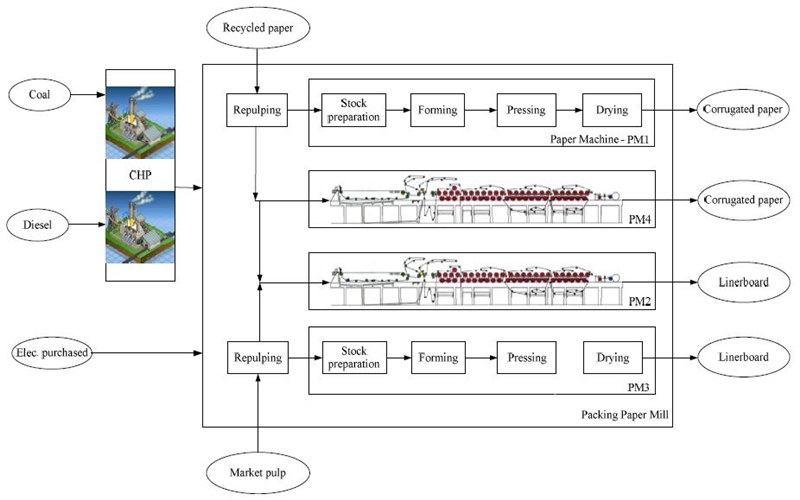
Four different Fourdrinier paper machines (PM), as shown in Table 1, were installed in this paper mill with 750 kt (kilotons) of total installation capacity. As shown in Fig. 1 and Table 1, PM1 (the 1st Paper Machine) and PM4 were used to produce corrugated paper, while PM2 and PM3 were used to produce linerboard. In the base year (2015), the case packing paper mill manufactured 682.3 kt of corrugated paper and linerboard, among which 32% was corrugated paper and the rest 68% was linerboard. For producing these paper and paperboard, 275 kilo tons of coal equivalent of energy was used in the packing paper mill.
Table 1.
Paper machine installed in the packing paper mill
There were 24 measures covered in the operational boundary since no mechanical and/or chemical pulping process was involved in the case paper mill. Note that heat recovery from recycled paper deinking effluent was excluded here because the paper mill did not utilize deinked pulp for papermaking.
3.2 Energy mix of the packing paper mill
Energy used for packing paper production is either produced onsite or imported as electricity. The share of fuels depends on the structure of energy production. Fig. 2 presented the energy consumption structure of the case paper mill. The papermaking process use large quantity of different secondary energies, generally in the form of steam, electricity and gas etc., in all kinds of its production units. Sometimes, the electricity generated from CHP onsite could not satisfied with the paper production. It has to be purchased from the grid for both cases. The share of electricity purchased from grid was 4.88% for the studied paper mill.
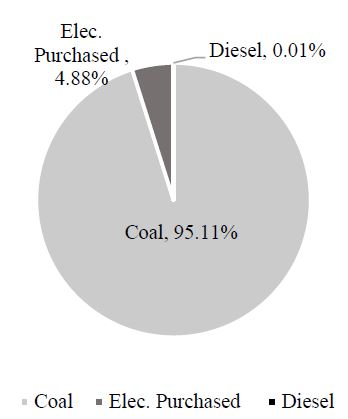
As there were four coal combusted boilers installed, 95.11% of energy was consumed in the form of coal. The steam transformed from coal and consumed on pulp and paper production was not recalculated here.
3.3 Potential application rate of energy efficiency measures
The potential application rate of all the selected energy-saving measures in the packing paper mill in the base year was shown in Table 2.
Table 2.
Potential application of energy saving measures in the packing paper mill
| No. | Energy-Efficiency Measures/Technologies | Apply this measure? * | Potential application rate | Applied by |
|---|---|---|---|---|
| Repulping of purchased pulp & recycled paper | ||||
| T1 | Continuous drum pulper | B | 33% | PM1, 4 |
| T2 | High efficient repulper rotor | B | 60% | PM1, 2, 4 |
| Papermaking | ||||
| T3 | High-efficiency double-disc refiners | A | 100% | PM1-4 |
| T4 | Gap forming | C | 0% | N/A |
| T5 | Shoe press | B | 13% | PM4 |
| T6 | Hot pressing | B | 33% | PM1, 4 |
| T7 | Stationary siphons | B | 40% | PM3 |
| T8 | Turbulent bars | B | 40% | PM3 |
| T9 | Improved dry fabric performance | B | 87% | PM1-3 |
| T10 | Enclosed paper machine hood | No | 0% | N/A |
| T11 | Air system optimization | B | 40% | PM2, 4 |
| T12 | Waste heat recovery | B | 40% | PM2, 4 |
| T13 | Anaerobic wastewater treatment and methane use | B | 60% | PM1, 2, 4 |
| T14 | Sludge recovery and utilization | A | 100% | PM1-4 |
| T15 | Steam leaks repair | B | 60% | PM1, 2, 4 |
| T16 | Insulate bare equipment and pipe | B | 60% | PM1, 2, 4 |
| T17 | Compressed air system optimization | A | 100% | PM1-4 |
| T18 | High efficiency motors | B | 47% | PM1, 2 |
| T19 | Vacuum system optimization | B | 60% | PM1, 2, 4 |
| General measures | ||||
| T20 | Adjustable-speed drives | B | 60% | PM1,2,4 |
| T21 | Energy-efficient lighting | A | 100% | PM1-4 |
| T22 | Steam traps maintenance | B | 33% | PM1, 4 |
| T23 | Condensate return | B | 60% | PM1, 2, 4 |
| T24 | Real-time energy management system | B | 40% | PM3 |
Excluding gap forming (T4) and enclosed paper machine hood (T10) out of 24 energy efficiency measures, the remaining 22 measures were selected by the mill to analyze their energy savings after careful consideration. Among these measures, high-efficiency double-disc refiners (T3), sludge recovery and utilization (T14), compressed air system optimization (T17), and energy-efficient lighting (T21) were supposed to be applied 100% in this paper mill. Some of the measures have already used in some paper machines, e.g. shoe press (T5) only had 13% of application rate which means only applied this measure on PM4. Because other paper machines have already installed shoe press initially. However, continuous drum pulper (T1), hot press (T6), and steam traps maintenance (T22) with 33% of potential application indicated these measures would be employed by PM1&PM4. The measures with 40% of application, such as stationary siphons (T7), turbulent bars (T8), and real-time energy management system (T24), were supposed to be applied by PM3. While air system optimization (T11) and waste heat recovery (T12) also with 40% of potential application were applied by PM2&4. The measure of high efficiency motors (T18) with 47% of application was adopted by PM1&2. There are 7 energy measures with 60% of potential application that indicated these measures were used by all paper machines except PM3. Besides, the measure of improved dry fabric performance (T9) with 87% of application was utilized by PM1-3.
3.4 Energy savings and CO2 emissions reduction
The estimated energy savings of each energy efficiency measure were presented in Appendix Table, in which, specific electricity, fuel, and final energy savings, CO2 emission reductions, investment cost, and simple payback period from the 22 selected technologies were calculated and displayed based on the evaluation results. It can be seen that there were 8 electricity saving measures achieved 35.7 GWh/year. Another 11 fuel saving measures could reduce 1,741 TJ of fuel in the base year for the case paper mill. Besides, shoe press (T5) and anaerobic wastewater treatment and methane utilization (T13) could save 223.8 TJ of fuel while also used additional 2.6 GWh of electricity. Only Sludge recovery and utilization (T14) could save both electricity and fuel with approximate 206 TJ of final energy savings.
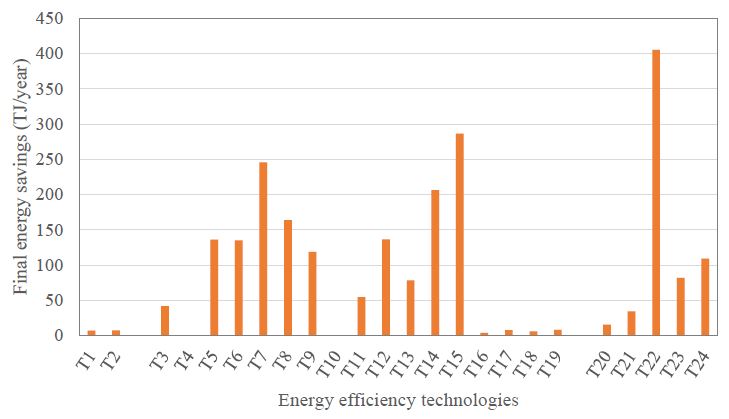
Fig. 3 presented the specific final energy savings of each measure in the studied packing paper mill. Among the 22 energy efficiency technologies, the application of those technologies that could reduce more than 100 TJ (10 of 22 measures) have the potential of reducing final energy use by 1,943 TJ annually, which accounts for 84.8% of total final energy savings. Steam traps maintenance (T22) has the most significant final energy savings that can reduce 405 TJ/year. Technologies that perform energy saving cost effectively include stationary siphons (T7), turbulent bars (T8), improved dry fabric performance (T9), sludge recovery and utilization (T14), steam leaks repair (T15), and steam traps maintenance (T22). These technologies could achieve final energy savings more than 1,426 TJ/ year.
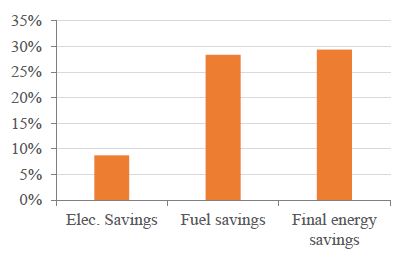
Above all, the electricity saving was 33.5 GWh, fuel saving was 2,170 TJ, final energy saving was 2,290 TJ, respectively, in the packing paper mill. The reduction of CO2 emissions due to energy efficiency improvement was 243 kt CO2, which means 32.3% of total carbon emissions could be mitigated for the case mill if applied the 22 selected energy efficiency measures. Fig. 4 indicated the share of annual energy savings. As can be seen, the annual electricity savings and fuel savings account for 8.8% and 28.4% of total electricity and fuel use. Its annual final energy savings was equivalent to 29.4% of that use in the base year. In addition, the payback period for the total investment for the selected energy efficiency measures was 1.6 years.
3.5 Discussion
It should be noted that not all the selected measures were applied in the packing paper mill thoroughly. There were only four measures were chosen to applied completely (see Table 2), i.e. high-efficiency double-disc refiners (T3), sludge recovery and utilization (T14), compressed air system optimization (T17), and energy-efficient lighting (T21), for their remarkable energy savings with less investment cost. The other 18 measures were not 100% applied based on the comments from filed study results. Thus, more final energy would be saved than 2,290 TJ per year if these measures were penetrated with higher application rate. Besides, EGARE tool for PPI could also give more accurate results when the mill-specific energy and cost data were given in the energy efficiency measures sheet for each measure instead of the default values.
4. Conclusions
It is essential to promote energy saving and emission reduction in the paper industry. In this work, we estimated the energy savings of a typical packing paper mill with the help of a user-friendly EAGER tool. The tool could be used to assist manager of paper mills to analyze energy savings. In totally 22 selected energy efficiency measures were applied to assess their saving potential. The results showed that 2,290 TJ of final energy could be saved annually, corresponding to 29.4% total energy use reduction for the packing paper mill. The CO2 reductions potential was 32.3%. This analysis could serve as a reference for analyzing energy savings of paper mill. It also provides manager or decision makers with proper assessment and information on prioritize energy efficiency improvement options. It suggests that the pulp and paper mills should encouraged to use this method estimating energy saving potential, and improve their energy efficiency with suggested measures in order to reduce energy consumption and related carbon emissions further in the near future.
