

1. Introduction
2. Materials and Methods
2.1 Data collection
2.2 Assumption
2.3 Life cycle assessment (LCA)
3. Result and Discussion
3.1 Global warming impact
3.2 Carbon tax
4. Conclusions
1. Introduction
The world is currently facing a natural resource crisis. The shift from an anthropocentric to an ecocentric worldview does not inherently resolve issues related to natural resource depletion. Achieving meaningful paradigm shifts requires efficient and sustainable innovations in natural resource utilization.1) Climate change poses a significant threat to humanity, adversely affecting fundamental needs such as food production, water distribution, and energy access.
Through the Paris Climate Agreement at COP21 in 2015, numerous countries committed to limiting the increase in Earth’s surface temperature to no more than 2°C above pre-industrial levels, with efforts to further restrict this increase to 1.5°C. The Indonesian government’s energy policy aims for a renewable energy share of 23% by 2025, increasing to 31% by 2050.2) Currently, renewable energy constitutes only 13% of the national energy mix.3) This policy is grounded in the principle that energy resources are not merely commodities but essential capital for national development.
Biomass is considered one of the most promising alternative energy sources and can be derived from various feedstocks.4) Biomass-based energy is expected to play a critical role in future sustainable energy solutions. Wood pellets produced from forest biomass offer a more environmentally friendly alternative to fossil fuels.5) Biomass cofiring is regarded as the fastest and most cost-effective method to support a just energy transition in Indonesia. The country aims to implement biomass cofiring with a target of 10 million tonnes per year. Government policy ensures that the cofiring initiative does not result in increased electricity generation costs. Consequently, instead of wood pellets, wood chips of specific sizes—suited to the type of boiler—are used. Indonesia’s cofiring policy for pulverized coal (PC) boilers includes using sawdust with particle sizes ranging from 2.5 to 3 mm.
Several factors must be considered when utilizing biomass as an energy source, including the energy efficiency of conversion technologies, life cycle efficiency, and environmental impacts. A comprehensive evaluation of the biomass production life cycle is essential, encompassing production, processing, and energy conversion phases.
Perum Perhutani, a state-owned enterprise, manages forests on the islands of Java and Madura. The company’s portfolio has traditionally focused on long-term products such as timber and pine resin derivatives. Currently, Perum Perhutani is undergoing a short-term business transformation by developing biomass products, including wood pellets and sawdust sourced from Energy Plantation Forests (HTE), as part of its new portfolio. As of 2024, approximately 45,000 ha of HTE have been established, with a target expansion to around 61,000 ha by 2029.
Effective control of greenhouse gas (GHG) emissions and other pollutants requires prioritizing efficiency across the entire energy value chain, including production, transmission, distribution, and consumption.6) Recent studies on wood pellet products primarily emphasize the environmental advantages of renewable energy but often overlook comprehensive life cycle considerations. According to Hosseinzadeh-Bandbafha et al.,7) extensively researched renewable energy sources include biodiesel derived from oilseeds and algae, as well as widely used motor fuels such as ethanol, biomethane, and biogas. In contrast, biomass remains one of the least studied renewable energy sources. Conducting a life cycle assessment (LCA) of biomass is essential to evaluate its effectiveness as a bioenergy source, particularly during the production phase in industrial plantation forest systems, where significant emissions may occur.
Fig. 1 illustrates the fundamental concept of the study, in which a complete life cycle process helps to describe the emissions generated by a product.
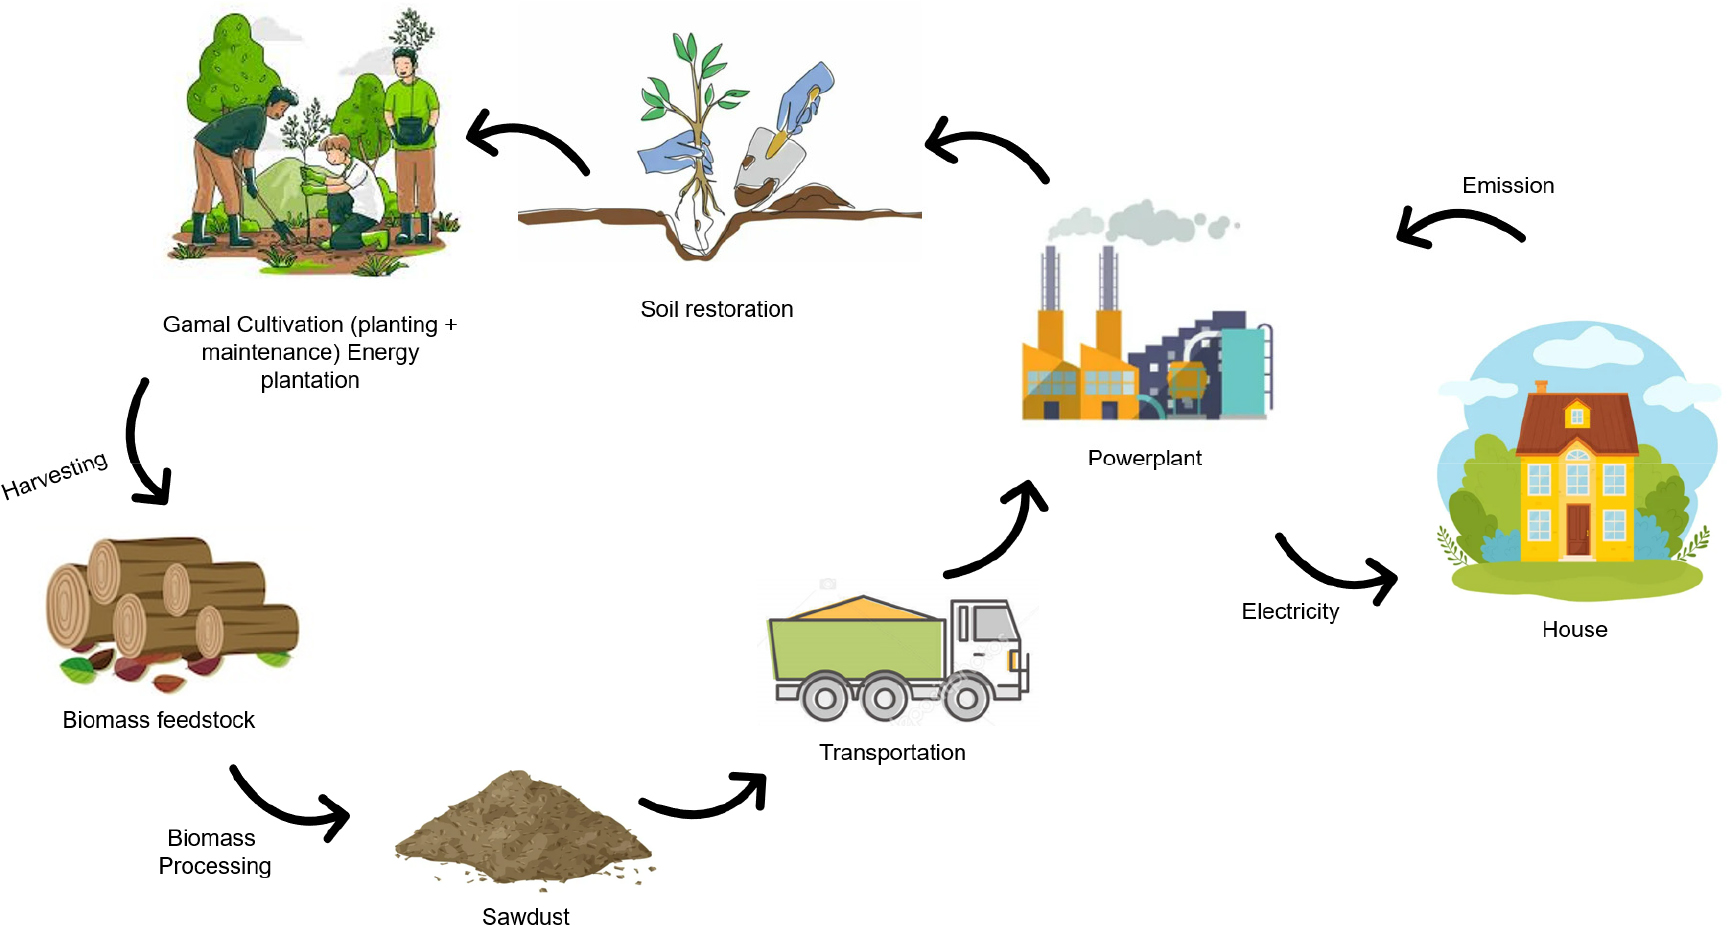
LCA is a method for evaluating the potential environmental impacts of a product, process, or service. LCA helps identify the benefits of a product across various environmental impact categories, addressing both local and global concerns.8)
2. Materials and Methods
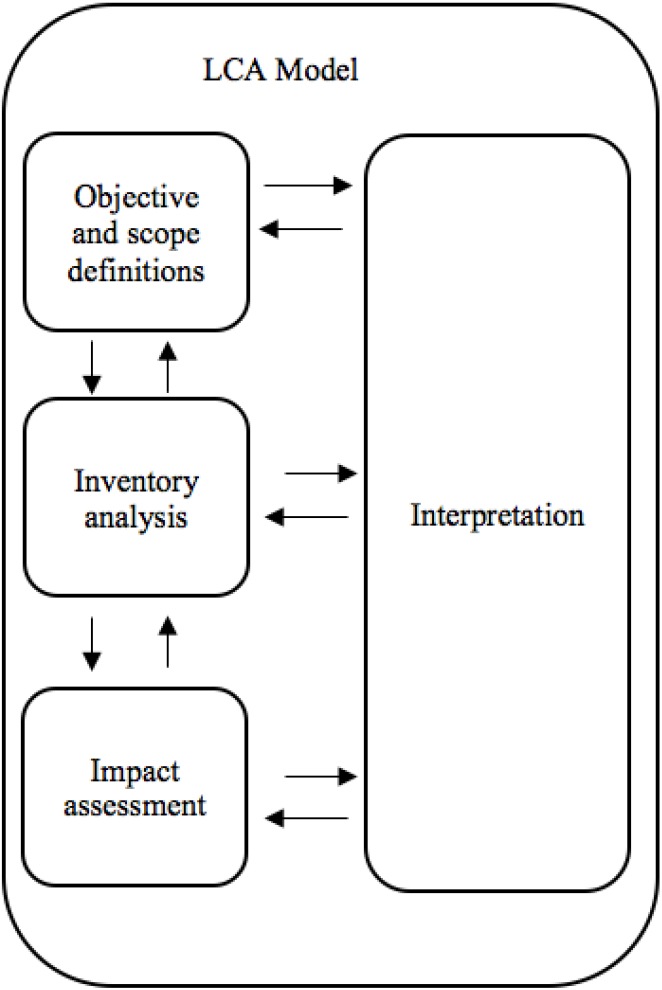
Various standards for LCA have been developed by the International Organization for Standardization (ISO) to promote consistent and reliable environmental evaluations. According to ISO 14040, LCA is a critical methodology for evaluating the inputs, outputs, and potential environmental impacts associated with a product system throughout its entire life cycle. The LCA process comprises four stages: goal and scope definition, life cycle inventory analysis, life cycle impact assessment, and interpretation of results (Fig. 2).
In this study, an LCA was conducted to calculate the emissions produced by sawdust (particle size 2.5–3.0 mm) used as fuel for cofiring in a pulverized coal-fired power plant (PLTU), under various conditions. The sawdust originates from biomass produced by integrated energy plantation forests (HTE) managed by Perhutani. These HTEs employ a short rotation coppice (SRC) system, with Gamal (Gliricidia sepium) selected as the primary plant species. Gamal is considered an ideal SRC species for cultivation on Java Island. Growth and adaptability assessments indicate that Gamal is a leguminous species capable of thriving under a wide range of environmental conditions, including altitudes from coastal areas up to 1,500 meters above sea level and annual rainfall ranging from 600 to 3,500 mm. It grows effectively in most soil types, except those with high acidity or excessive levels of calcium (Ca) or aluminum (Al), and across most land-use types, excluding waterlogged areas.9)
2.1 Data collection
The data sources consist of primary and secondary data collected from July 2023 to December 2023. The research location is the Energy Plantation Forest (HTE) managed by Perum Perhutani, specifically within the Forest Management Unit (KPH) of Semarang. For comparison and data validation purposes, additional observations were conducted in the Energy Plantation Forests located in KPH Sukabumi, which supplies biomass to the Pelabuhan Ratu coal-fired power plant (PLTU), and in KPH Mantingan, which supplies the Rembang PLTU.
Primary data on the production process were obtained through direct observation of seedling preparation, land preparation, planting, maintenance, harvesting, and factory-based production activities. Secondary data were gathered from company documents, including standard operating procedures, records of raw material usage, specifications of machinery and equipment utilized at each stage of the production process, and reports from previous studies. Data processing and environmental impact analyses were conducted using the SimaPro application, a software designed to collect, analyze, and monitor the environmental impacts of products or services.
2.2 Assumption
Considering the extensive system boundaries of the integrated biomass business, the assessment encompasses biomass cultivation from energy plantation forests (HTE), product processing, transportation, and land restoration. The model is based on carbon-neutral assumptions, a methodology adopted in several previous LCA studies on bio-pellets, including those by Murphy et al.,10) Nian,11) and Yang et al.12)
During the cultivation process in HTEs, land preparation and harvesting are conducted manually, relying on local labor rather than heavy machinery. Notably, labor inputs are excluded from the impact assessment inventory.13) Transportation in this study primarily occurs by land and is involved during planting, maintenance, harvesting, and product delivery stages. During planting and maintenance, transportation is used for delivering plant seedlings. At the harvesting stage, Gamal logs are transported to the factory, and the final product is subsequently delivered to the power plant for use in the cofiring system. During ash disposal, the ash is transported to a cement factory located near the power plant.
The ideal model assumes negligible biomass losses during transportation. Biomass loss is only accounted for during the wood processing stages (chipping, drying, and milling), totaling approximately 43%. Fertilization is applied during the nursery, planting, and maintenance phases, increasing Gamal productivity by 10–15%.15) GHG savings, specifically CO2 emissions, are calculated and compared under different scenarios. The complete set of ideal assumptions used in the model is presented in Table 1.
Table 1.
Assumptions description
| Ideal assumptions | Description |
|
Biomass plantation cultivation | The biomass plantation cultivation process follows standard procedures established by Perum Perhutani, including specified doses of fertilizer and pesticides. |
| Carbon neutral | The carbon absorbed by biomass through photosynthesis is considered equivalent to the carbon released from the wood raw material throughout its life cycle.14) |
| Human labour | Some activities in this study still rely on manual labor; however, labor inputs were not included in the inventory model.13) |
| Mass loss | No biomass loss is assumed during transportation (from forest to factory and from factory to power plant). Biomass loss occurs only during wood sawdust production, estimated at 43%. |
| Field productivity |
Based on harvesting trials conducted in KPH Semarang, Perum Perhutani, fertilized Gamal trees (average age: 3 years) produce 10.092 kg/tree, totaling 50,056 kg/ha from 4,960 trees. Unfertilized trees produce 9.0 kg/tree or 45,000 kg/ha. |
| Soil condition | The soil at all research locations is assumed to have optimal nutrient content, resulting in consistent productivity across all sites. |
| Social condition | No social conflicts were encountered during the study. |
| Field emission | Field emissions were not considered in this study. |
|
Conversion number |
The conversion rate of wood biomass (logs) into wood chips and sawdust from Gamal (Gliricidia sepium) is based on findings from the Perhutani Forestry Institute.15) |
2.3 Life cycle assessment (LCA)
2.3.1 Goal and scope definition
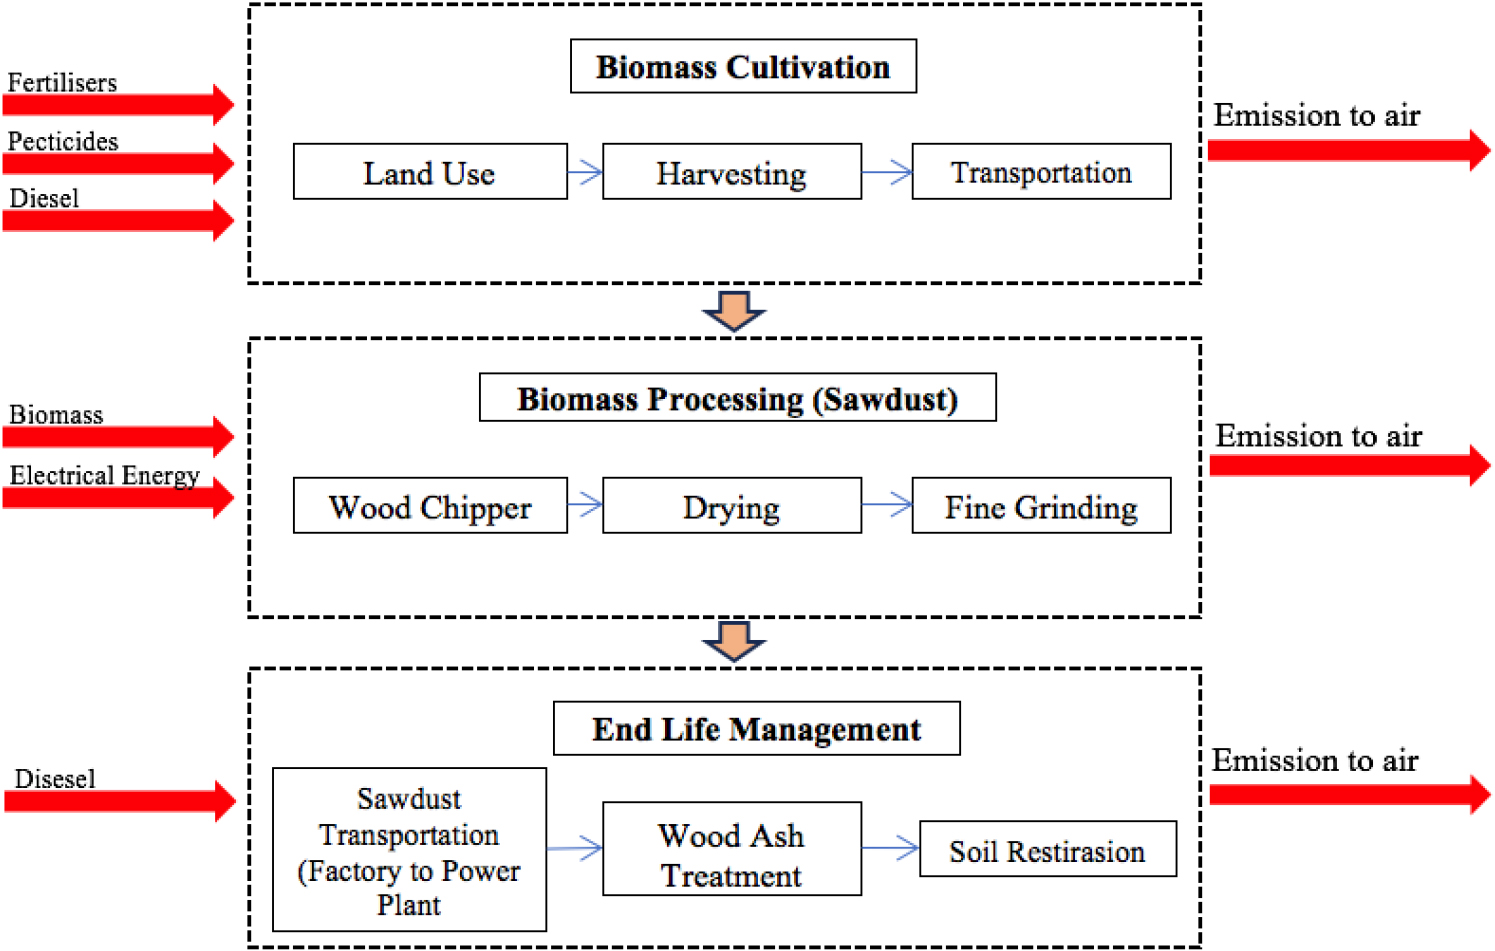
This study analyzes the environmental impacts of using sawdust (particle size 2.5–3 mm) produced from energy plantation forests (HTE) which is used as a cofiring feedstock in coal-fired power plants (PLTU). This study adopts a cradle-to-grave approach, meaning the assessment encompasses the entire life cycle of the product—from raw material extraction (cradle), through factory production and distribution (gate), to product use and end-of-life management (grave). All processes included in the cradle-to-grave analysis are presented in Fig. 3. The scope of this research includes sawdust production derived from cultivating 1 ha of Gamal over a 15-year cycle. The HTE production cycle spans 15 years, including five harvest cycles, with a planting density of 2 × 1 meters (4,960 trees/ha). Biomass cultivation is carried out in Energy Plantation Forests, adhering to forest sustainability considerations as regulated by the Forest Sustainability Management Plan.
Sawdust is considered more efficient and economical than wood pellets for implementing the pulverized coal power plant cofiring policy in Indonesia.16) Generally, sawdust production involves biomass cultivation, sawdust manufacturing in factories, and transportation to power plants. At the end of the 15-year cycle, soil restoration is carried out prior to replanting. This assessment specifically focuses on global warming impacts, analyzing emissions generated during sawdust production from cultivating 1 ha of energy plantation forest over the complete cycle.
Due to system complexity, several simplifications and assumptions were made when developing the evaluation model: the environmental assessment covers raw material production, raw material processing, transportation of raw materials and final products, ash disposal, and soil restoration. At the end of the cycle (year 15), soil restoration is performed before replanting.
Accordingly, all emissions and resource consumption associated with biomass production and its supply chain are included. Resource inputs consist of seeds, fertilizers (compost, inorganic fertilizers, manure, and base fertilizers), herbicides, nursery and planting materials (e.g., sand, polybags, topsoil, seedbeds, and growth stimulants), diesel fuel, and electricity.
The primary objective of this study is to describe the environmental profiles of sawdust from THE and to demonstrate that CO2 emissions from biomass energy are lower than those from coal-based energy. More broadly, this research aims to provide valuable information to support public policy development regarding renewable energy, particularly biomass cofiring, as part of a just energy transition in Indonesia. This study also compares GHG savings, specifically CO2 emissions, under two different parameter conditions: fertilizer usage and biomass mass loss.
2.3.2 System’s functions and functional unit
The functional unit (FU) is a critical component of any LCA, as it provides the reference against which all data in the assessment are normalized. In many LCA studies of agricultural production systems, the FU is typically defined based on area (e.g., 1 ha). However, in LCA studies related to electricity generation, a mass-based FU is less common. Instead, a FU based on energy output—most commonly, 1 kWh of electricity produced—is widely used, as it directly reflects the primary function of electricity generation and enables meaningful comparisons across different product systems.
2.3.3 Inventory analysis
2.3.3.1 Biomass cultivation
The inventory for biomass HTE production activities includes several key components: nursery, planting, maintenance, harvesting, and transportation from the forest to the log yard and factory. The cultivation schedule for 1 ha of biomass HTE over the cycle involves five nursery periods (in years 1, 4, 7, 10, and 13); planting is conducted only once, in the first year; maintenance is performed annually; and harvesting occurs on a three-year rotation (Table 2). The cultivation process adheres to the standard operating procedures (SOPs) of Perum Perhutani.17) Nursery activities are incorporated within the planting inventory. The primary inputs for nursery activities are Gamal seeds and compost. One kg of Gamal seeds contains approximately 5,000 seeds with a germination rate of 60%, resulting in a seed requirement of approximately 1.56 kg/ha.
Table 2.
Biomass cultivation schedule in cycle
Fertilization is applied to enhance plant productivity and involves the use of compost, manure, inorganic fertilizers, and base fertilizers (P), totaling 6,085 kg/ha, of which 90% consists of manure applied during the planting stage. Detailed fertilizer usage is presented in Table 3.
Table 3.
Life cycle inventory of 1 ha biomass plantation in one cycle
The biomass harvesting process employed chainsaws, and the harvested material was transported to a temporary log yard. Harvesting was conducted in KPH Semarang, primarily on three-year-old Gamal trees, yielding an average of 10.09 kg per tree.15) This corresponds to an estimated total production of 50,056 kg per ha (4,960 trees per ha).
Diesel fuel was utilized for transporting seedlings from the nursery to the planting site (average distance of 10 km) and for transporting green biomass to the factory (average distance of 20 km). The harvesting process using chainsaws consumed an estimated 0.13 L/ha of oil and 0.46 L/ha of diesel fuel.18)
2.3.3.2 Sawdust production
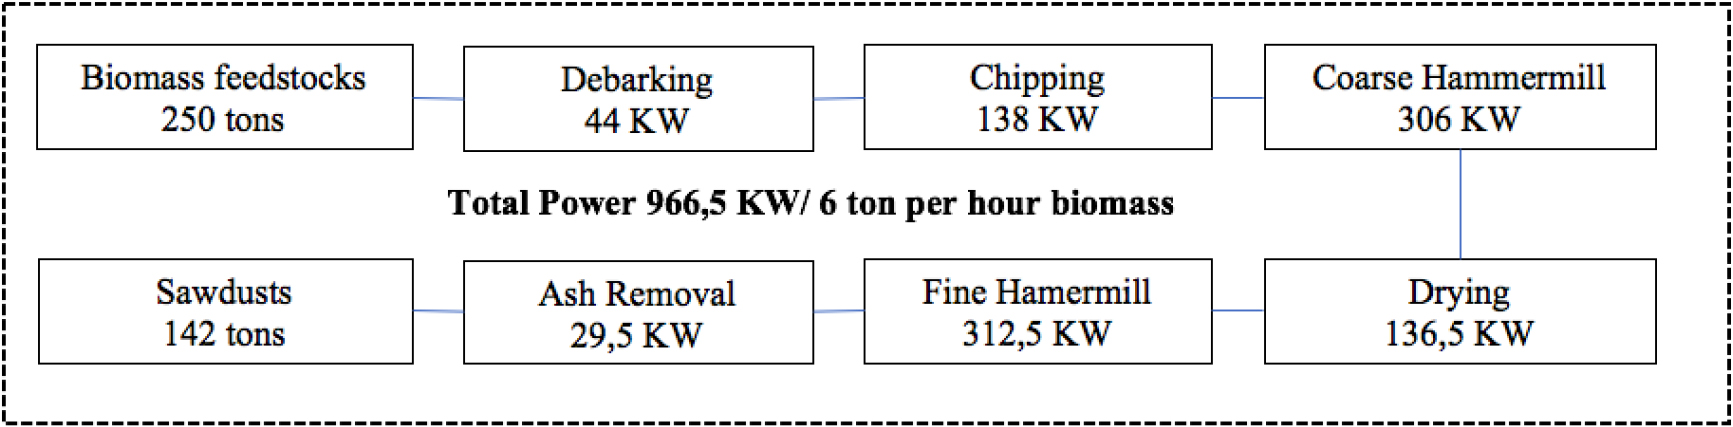
Sawdust production (particle size 2.5–3.0 mm) utilizes a production line consisting of a debarking machine, chipping machine, coarse grinder, dryer, fine grinder, and an integrated dust collector. The total power required for the production line is 966.5 kW, with a processing capacity of 6 tons per hour, as detailed in Fig. 4. The raw material intake is approximately 50 tons per ha per harvest, and the time required to process this material is 8.3 hours per ha. Consequently, the energy required amounts to 8,054.17 kWh per ha per harvest, totaling 40,270 kWh for the entire production cycle.
The life cycle inventory is presented in Table 4. This study assesses the environmental impacts of sawdust production, focusing specifically on electricity consumption during the production process. The inventory for wood chip production is based on Indonesia’s projected 2050 energy mix, consisting of 31% renewable energy and 69% non-renewable energy. This projection aligns with the Presidential Regulation of the Republic of Indonesia Number 22 of 2017 regarding the National Energy General Plan (Table 5).
Table 4.
Life cycle inventory saw dust production of 1 ha biomass plantation
Table 5.
National energy plan
2.3.3.3 End life management
In the final stage of the biomass cofiring LCA, sawdust is transported from the factory to the power plant, followed by ash treatment and land restoration activities. An inventory of end-of-life management activities is presented in Table 6.
Table 6.
Life cycle inventory end life management of 1 ha biomass plantation
Sawdust transportation to the power plant is conducted by land transportation, utilizing vehicles with a carrying capacity of 30 tons per trip, over an assumed average distance of 30 km. Bottom ash is transported to a nearby cement (mortar) factory, located within a maximum distance of 20 km. Biomass bottom ash (BBA) is used as a component in mortar production.19,20,21) Gamal plants have an ash content of approximately 7%,22) resulting in about 3.5 tons of ash per ha per harvest.
Post-harvest soil processing aims to maintain soil quality and aeration in preparation for replanting. Soil restoration includes the complete removal of plant residues and weeds from the planting area, along with improvements to soil structure.
2.3.4 Life cycle impact assessment method
The life cycle impact assessment (LCIA) method employed in this study is based on the ReCiPe 2016 Midpoint (H) framework. The ReCiPe Midpoint (H) (2016) method is a widely accepted tool for analyzing environmental impact categories, grounded in scientific consensus, and offers a balanced consideration of different time perspectives.23) ReCiPe Midpoint classifies emissions into 18 impact categories, including carcinogens, non-carcinogens, ozone layer depletion, aquatic ecotoxicity, terrestrial ecotoxicity, aquatic acidification, aquatic eutrophication, global warming, and non-renewable energy use.
This study specifically focuses on the impacts related to GHG emissions, particularly CO2. The impact of GHG emissions is calculated according to the following Eq. [1].
where IC is the specific impact (GHG emissions), calculated as the sum of total emissions estimated for each process (E1, E2, …) during each harvest cycle (n = 1, 2, 3, 4, and 5).
3. Result and Discussion
3.1 Global warming impact
Biomass energy is widely regarded as carbon neutral because it has a net-zero carbon balance. This means that the amount of carbon emitted during biomass use is equal to the amount of carbon absorbed by plants during their growth through the process of photosynthesis.1,24) The European Union (EU) states that CO2 emissions resulting from combustion—often referred to as direct emissions—for biofuels and biogases are assumed to be zero, as indicated in RED II in 2018. However, RED II also suggests that the reduction of GHG emissions from replacing fossil fuels with biomass will not reach 100%. The reduction rate for electricity generation varies significantly, ranging from 90% to as low as 7%.
While biomass is considered a CO2-neutral energy source, the preparation and processing of biomass into fuel may involve the use of fossil resources.25) In this study, emissions generated by the workforce are excluded from the input inventory, as noted by Wiloso et al.13) Ahamer26) defines total life cycle emissions as those released throughout the entire process, considering: (a) emissions from fertilization activities, (b) deforestation, and (c) emissions from fossil fuel use in harvesting, transportation, and production processes.
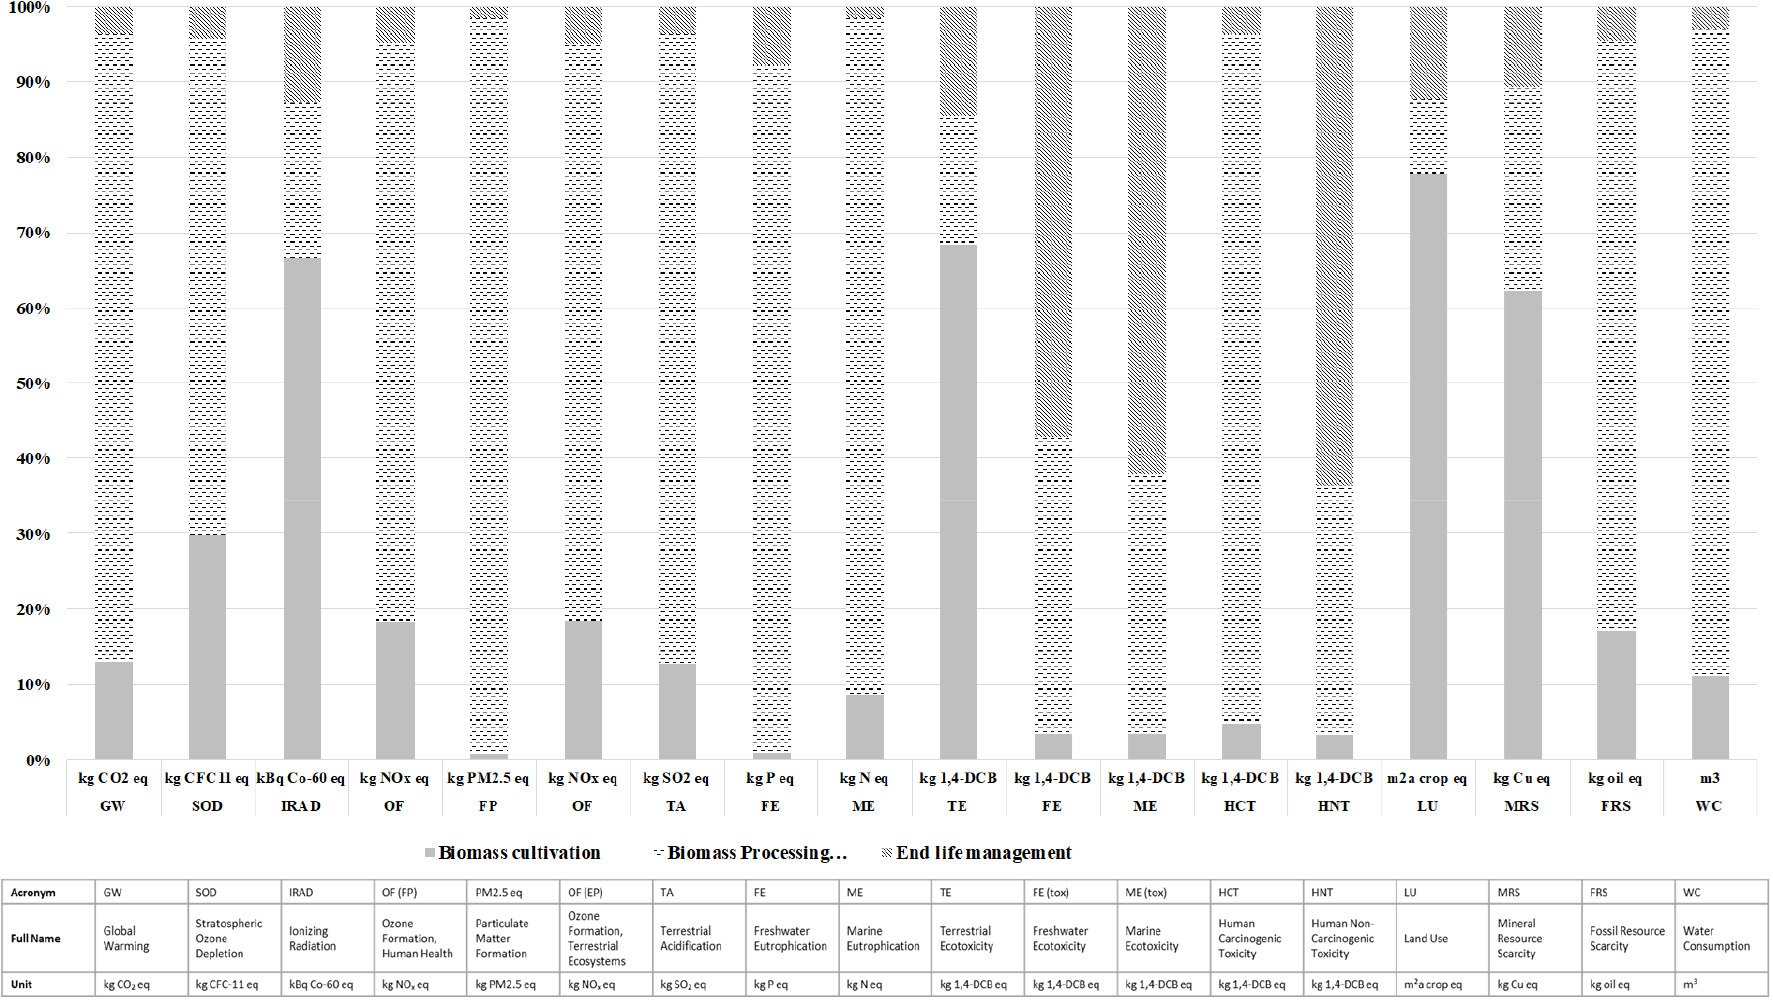
Fig. 5 presents the impact assessment profile of emissions released over one life cycle of Gamal energy plantation forest (HTE) across 18 ReCiPe Midpoint impact categories. In each impact category, the highest emission values are associated with the biomass processing/production stage. This is because the electricity used during processing is assumed to be dominated by 69% non-renewable sources.27,28) The composition of the energy mix significantly influences the emissions generated during the sawdust processing stage—the higher the share of renewable energy, the lower the CO2 equivalent (CO2 eq) emissions.
De la Fuente et al.29) argue that wood pellet production still has environmental impacts, primarily because it relies on electricity from fossil fuel sources. Similarly, the energy mix composition plays a critical role in determining the emissions from sawdust processing.
Table 7 shows that the total global warming impact for one Gamal cultivation cycle (15 years) is 42,487 kg CO2 eq, consisting of:
• Biomass cultivation: 5,512 kg CO2 eq (13%)
• Sawdust production: 35,416 kg CO2 eq (84%)
• End-of-life management: 1,558 kg CO2 eq (3%)
Table 7.
LCA result each impact category
Table 8 outlines the global warming impact at each stage of the production cycle, with the highest CO2 emissions occurring during the first and last harvests. The first harvest involves planting activities, while the last harvest includes soil restoration. Notably, factory processing accounts for 83% of the total CO2 emissions. Righi et al.30) calculated that CO2 emissions generated throughout the wood pellet production chain—utilizing pine logging waste over a 45-year cycle and including ash handling from combustion with a landfill distance of 40 km—amount to 126 g CO2 eq/kg. More than 50% of these emissions result from the wood pellet production process, primarily due to electricity and fossil fuel consumption.29,31)
Table 8.
Global warming impact (kg CO2 eq/ha/cycle)
One ha of HTE produces 250,000 kg of green biomass, equivalent to 142,500 kg of wood chips per cycle (with a yield of 57%). The total CO2 eq emissions from sawdust in this process amount to 42,487.33 kg/ha/cycle, or 298 g CO2 eq/kg. The average calorific value of sawdust is 4,100 kcal/kg with an average moisture content of 10%. Assuming a boiler efficiency of 87% and a performance efficiency of 77%,32) the energy produced from sawdust is approximately 1,344 kWh/ton, which translates to a sawdust consumption of 0.744 kg/kWh produced. The emissions associated with this energy production amount to 222 g CO2 eq/kWh. The highest emissions are generated during the sawdust production process, amounting to 184.93 g CO2/kWh or 248.54 g CO2/kg. The emissions produced from each stage of the process are detailed in Table 9.
Table 9.
Global warming impact in boundary system
In comparison, Wiloso et al.13) found that global warming emissions from the LCA of wood pellets made from sorghum amount to 289 g CO2 eq/kg. The emissions produced during electricity generation in their study were higher than those observed in this study. This discrepancy arises from the management of ash from biomass combustion and the longer transportation distances to the power plant. In the current study, the biomass feedstock is sourced through vertical integration between the HTE and the factory, emphasizing circular economy principles by minimizing waste. The combustion byproducts—fly ash and bottom ash—are repurposed as a fertilizer mixture, increasing the fertilizer’s pH to 8.52.33) In addition, ash is also used as an additive in mortar production, where its inclusion can improve the compressive strength of the mortar.34)
Bacenetti et al.35) calculated the CO2 emissions produced during the biomass wood chip production process from SRC poplar. This process includes planting, maintenance, harvesting (using a harvester that produces wood chips), transportation, and soil restoration, resulting in emissions of 336 g CO2 eq/kg. Approximately 50% of these emissions are generated during the fertilization and harvesting stages.
In this study, the results showed emissions of 298 g CO2 eq/kg, which is lower than Bacenetti’s findings. This reduction can be attributed to the fact that the Gamal plantation applied fertilizers and pest control only once during the first year, whereas Bacenetti’s study likely involved annual applications and accounted for soil emissions from the application of mineral and inorganic nitrogen. Additionally, poplar harvesting in Bacenetti’s study was carried out using mechanized harvesters powered by fossil fuels. The global warming impact comparison per kg of biomass product—sawdust, wood chips, and wood pellets—based on calculations using different process stage methods can be seen in Table 10.
Table 10.
Global warming impact comparation per kg product
| Process | Global warming impact (gr CO2 eq) | |||||
|
This study sawdust |
Pellet Sorghum13) | Pellet Pine30) |
Wood Chips Poplar35) |
Pellet Miscanthus10) |
Pellet Switchgrass37) | |
| Biomass production | 38.69 | 62.0 | 15.0 | 156.2 | 101.0 | 6.0 |
| Pellet processing | 248.54 | 177.0 | 69.0 | 83.2 | 263.0 | 197.0 |
| Electricity generation | ||||||
|
Power plant infrastructure, ash treatment (biomass neutral) | - | 50.0 | - | - | - | - |
|
Transportation to power plant, ash treatment (biomass neutral) | 7.28 | - | - | - | - | - |
|
Biomass burning, transportation to power plant, ash treatment | - | - | 42.0 | - | - | - |
|
Transportation to power plant (biomass neutral) | - | - | - | 33.1 | - | - |
| Soil restoration | 2.72 | - | - | 7.5 | - | - |
| On field emission | - | - | - | 56.3 | - | - |
| Total | 298.2 | 239.0 | 126.0 | 336.3 | 364.0 | 203.0 |
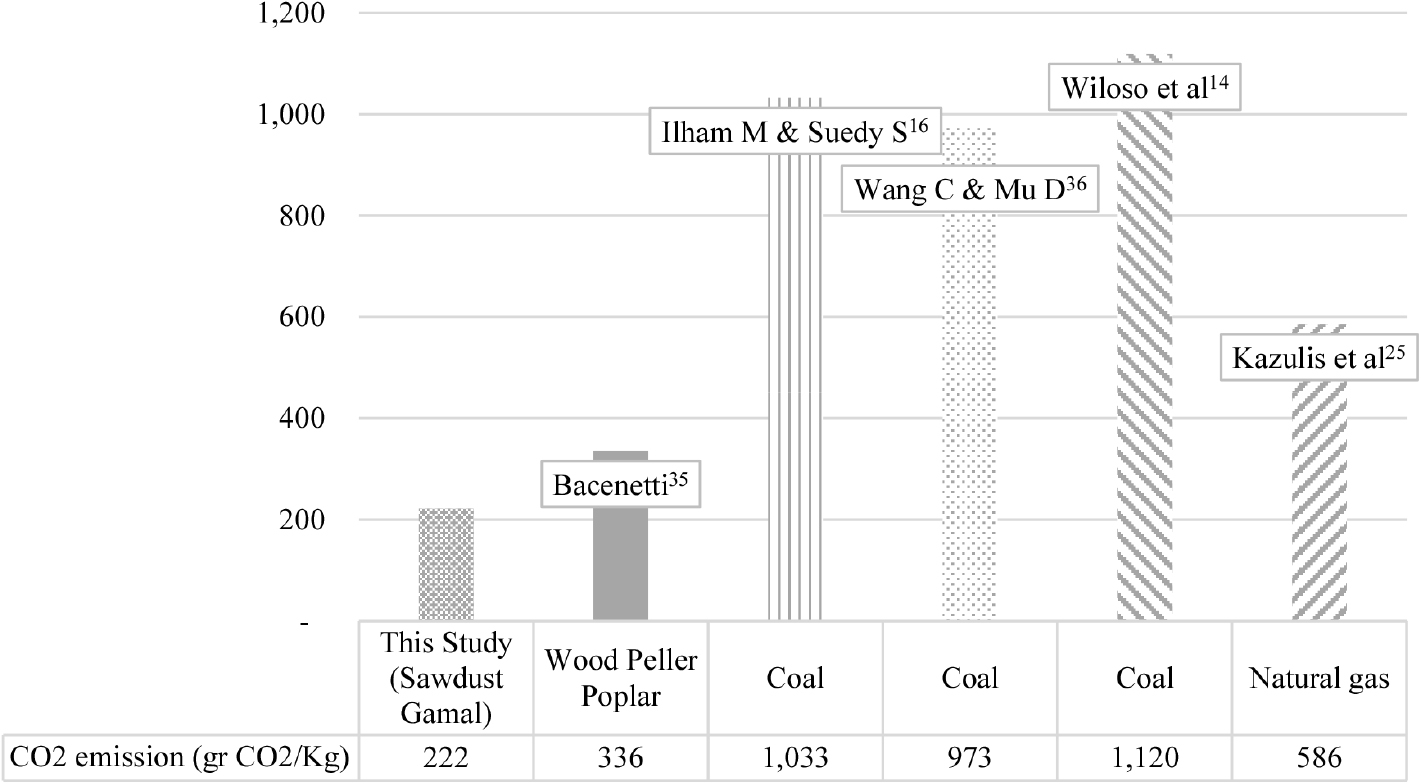
Fig. 6 presents several references indicating that CO2 emissions from coal-based energy are nearly four times higher than those from biomass-based energy. Wang et al.36) calculated coal emissions at 972 g CO2/kg, with approximately 90% of the emissions originating from the coal combustion process. This study assumes biomass to be carbon neutral, where the CO2 absorbed during forest growth is considered equivalent to the CO2 released back into the atmosphere through wood oxidation in the later stages of its life cycle.
Sebastián et al.38) estimated average GHG emissions from biofuel combustion at 11 g CO2 eq/kWh. Therefore, if this study includes combustion-related CO2 emissions in its calculations, the total CO2 emissions would amount to 233 g CO2/kWh.
GHG savings (kg CO2 eq/kWh) are calculated by comparing the CO2 emissions per kWh from coal-based energy—reported as 1.12 kg CO2 eq/kWh13)—with emissions from biomass-based energy, which are 0.222 kg CO2 eq/kWh, along with several other results under different assumption scenarios.
As shown in Table 11, changes in assumptions regarding mass loss or fertilization do not significantly affect the GHG savings value. The resulting GHG savings range from 79% to 80%.
Table 11.
GHG saving comparation
| Mass loss | Fertilizer |
Yield (ton/Ha) | Global warming (kg CO2 eq/kWh) |
GHG saving (%) | |
| SFC* | Cofiring | ||||
| Yes* | Yes | 50 | 1.12 | 0.228 | 80 |
| No | 45 | 1.12 | 0.230 | 79 | |
| No* | Yes | 50 | 1.12 | 0.222 | 80 |
| No | 45 | 1.12 | 0.219 | 80 | |
3.2 Carbon tax
Finland took a bold step by introducing a carbon tax in 1990. This tax applies to fuels such as coal and natural gas, with an average rate of €20 per ton of CO2 eq as of 2008. In 2004, Latvia introduced an emissions tax on fuel use, set at €30 per ton of CO2.39,40) Japan has implemented a carbon tax since 2012, with a tax rate of 2 USD per ton of CO2 eq in 2016.41)
Singapore was the first country in Southeast Asia to implement a carbon tax, launching the initiative in 2019 at a rate of 5 USD per ton of CO2 eq, which remained effective until 2023. The tax is planned to increase to between 50 and 80 USD per ton by 2030.42) According to Bavbek,43) South Africa began effectively implementing a carbon tax in January 2017, with a rate of 8 USD per ton of CO2 eq.
The Indonesian government initiated its carbon tax policy following the enactment of Law Number 7 of 2021 on the Harmonization of Tax Regulations. The primary objectives of this policy are to internalize environmental costs, promote the transition to clean energy, fulfill international decarbonization commitments, and address negative externalities.44) Initially, Indonesia will implement a carbon tax in the coal-fired power plant sector, setting the rate at 30 IDR per kg of CO2 eq.
This tax rate is lower than the previously proposed rate of 75 IDR per kg of CO2 eq and is also below the rates recommended by the World Bank and the IMF.45) The implementation of the carbon tax policy for coal-fired power plants (PLTU) is relatively lenient, as the emission threshold (cap) is set at a high level, ranging from 911 to 1,297 g CO2/kWh.
Based on primary data from PT PLN EPI, the Rembang Coal-Fired Power Plant consumed 1.097 million tons of coal from February to December 2024. The average gross calorific value (GCV) of the coal was 4,353 kcal/kg, with a price of 759,409 IDR per ton. The energy output from coal was 1.43 kWh/kg. In comparison, sawdust has a calorific value of 4,100 kcal/kg and an energy output of 1.34 kWh/kg. To implement 100% cofiring, approximately 1.040 million tons of sawdust would be required.
According to Hendrasetiafitri et al.,46) the economic price of biomass from HTE for cofiring is 833,813 IDR/ton, resulting in a price gap of approximately 75,000 IDR/ton between coal and biomass for cofiring. Coal emissions, according to Yin,47) are 783 g CO2 eq/kWh, which is equivalent to 1.12 tons CO2 eq/ton of coal (with an energy output of 1.43 kWh/kg). In comparison, the emissions from sawdust in this study are 222 g CO2 eq/kWh.
During the simulation period from February to December 2023, consuming 100% coal produced 1.155 million tons of CO2 eq, whereas using 100% biomass (sawdust) resulted in 336 thousand tons of CO2 eq. Table 12 illustrates that if a carbon tax of 30 IDR/kg CO2 is implemented for 100% coal usage, the coal-fired power plant would pay 10% less in tax compared to using 100% biomass for cofiring. This is due to the higher price of biomass.
Table 12.
Simulation of total fuel cost in PLTU Rembang
Consequently, the implementation of a carbon tax of 30 IDR/kg CO2 eq has led power plants to prefer paying the carbon tax rather than absorbing the price difference associated with cofiring.
The carbon tax simulation shows that a reduction in fuel costs for cofiring power plants will only occur if the carbon tax rate is at least 6.5 USD/ton CO2. With a carbon tax of at least 6.5 USD/ton CO2, the use of biomass for cofiring becomes more attractive than coal in power plants due to its lower CO2 emissions, despite its higher cost.
In addition to implementing a carbon tax, and as part of efforts to accelerate the transition to renewable energy, the government has issued Ministerial Regulation No. 12 of 2023 concerning the Utilization of Biomass as Power Plant Fuel. However, the carbon economic value (CEV) resulting from cofiring implementation will only be granted to the power plant, which limits broader benefit sharing.
4. Conclusions
The LCA results for the integrated biomass sawdust production process, conducted using SimaPro software, clearly demonstrate that sawdust emissions significantly contribute to global warming. The impact is quantified at 222 g CO2 eq/kWh and 298 g CO2 eq/kg. The calculation of CO2 emissions encompasses the entire life cycle, including cultivation, product processing (manufacturing), and end-of-life management.
CO2 emissions from coal-based energy are three to four times higher than those from biomass energy. This indicates that implementing biomass cofiring can help Indonesia reduce GHG emissions. To ensure an effective transition from coal to biomass for CO2 emission reduction through cofiring, the enactment of a carbon tax of at least 6.50 USD/ton CO2 eq is necessary.
The calculation of CO2 emissions from biomass cofiring is also expected to serve as a basis for determining incentives for biomass development, particularly in the upstream (forest) and downstream (biomass processing plant) sectors.
