

1. Introduction
The understanding of surface properties is important not only in the paper industry, but also in other industries such as electronics, health-care, construction and the petroleum industry, to name a few. Surface properties include a surface roughness component and a surface friction component. The former is of a topographical nature whereas the latter is of a mechanical nature. At present, however, the relationship between the two has not been fully understood.
For a paper such as printing paper, writing paper and newsprint, it is assumed that smooth and uniform surface is required for end users. Accordingly, technologies have focused on minimizing the surface roughness as much as possible. Softness, absorbency, and strength are important attributes for a hygiene paper. Softness and absorbency are generally achieved by improving bulk which is defined as the inverse of density. Creping and embossing are the two primary processes to improve the bulk. However, these processes are accompanied by increasing the surface roughness.1)
Common uses of paper towel are wiping liquid spills and removing stains while providing good handfeel. Wiping requires a good absorbency capacity at a fast rate of absorption. Stain removal requires a good wet strength. For handfeel, both high bulk softness and high surface softness are desirable. Currently, paper towel is generally twoply and made by laminating two single-plies with each bottom side facing each other to minimize the sidedness. The bottom (or the wire) side is always rougher than the top (or Yankee) side. The sidedness of paper towel, however, may not be necessarily undesirable. It may be even preferable since the top side having the smooth surface can be attractive for handfeel while the bottom side having the rough surface may perform better for wiping spills and removing stains. Thus, it is conceivable that a paper towel having such sidedness should be superior to a two-ply towel without sidedness. To validate this concept, a relationship between the surface roughness and the surface friction should be established using a surface tester which is capable of determining the surface roughness and the surface friction at the same time.
In 1970s, Kawabata developed a mechanical testing system, known as the Kawabata KES system, to determine the handfeel of fabrics and non-woven substrates.2,3) It consists of 4 units: 1) Tensile/ shear tester (FB1), 2) Bending tester (FB2), 3) Compression tester (FB3), and 4) Surface tester (FB4) for surface roughness and surface friction. The Kawabata KES system has been established as the Japanese standard method in determining the handfeel of textiles and nonwovens.4) Later a KES-SE surface tester, a simple version of the surface tester (FB4), was introduced for tissue and towel.5-7)
The KES-SE surface tester uses two types of stylus. One is a single U-tube stainless wire, 0.5 mm in diameter for surface roughness measurements. The other is a finger-type probe consisting of 10 such single stainless wires for surface friction measurements. Yokura et al. compared a single U-tube stainless wire probe with a finger type probe for surface friction measurements of commercial toilet papers.8) The single U-tube wire probe was found to be more discriminating than the finger-type probe by showing a higher correlation with handfeel.
This suggests that the single U-tube wire probe can be used for both surface roughness and surface friction at the same time, thus eliminating the need of using a finger-type probe for surface friction separately.7-10) Yokura’s work, however, has not been applied for characterizing the surface properties of paper towel until the present study.
2. The Origin of Surface Roughness
2.1 Free-fiber ends: fiber level (microscale)
Carstens developed the free-fiber ends (FFE) test method to quantify the human tactile response (HTR) of velvety smoothness and softness for bathroom tissue and facial tissue products.4) Layered structure has been designed with hardwood fibers on the top (Yankee) side and with softwood fibers on the bottom. When creped, some of the hardwood fibers are freed on the top and stand up on the surface. These free-fiber ends are claimed to be responsible for providing a “velvet-like” tactile perception when a user rubs a finger over the paper.
The free-fiber ends were counted microscopically using an image analyzer. The degree of the surface roughness was shown to increase as the number of FFE increases. This suggests that the surface roughness measurement can be misleading in evaluating surface softness. In particular, it has been believed that the smooth surface roughness is better for subjective softness of tissue and towel since Hollmark’s work.11)
2.2 Creping process
Creping is one of the key processes for tissue and towel products. It is a very complicated process and is one of the most protected proprietary technologies. The objective of creping is to increase softness and bulk by sacrificing strength.1,11)
The factors influencing crepe structures are: fiber types, basis weight, sheet density, adhesive, creping (doctor blade) angle, sheet moisture, creping ratio, etc.1) Creping ratio is defined as a ratio of the speed of Yankee dryer to the speed of the reel machine. The crepe wavelength is an important parameter which determines critical mechanical properties. For very short wavelengths (i.e., micro-scale), the internal sheet structure is damaged by breaking the internal fiber-fiber bonds. This structure is called micro-crepe. Meanwhile, when the crepe wavelength is long, the internal structure is less damaged and the crepe is called macro-crepe.
It is critical to realize that both macro-crepe and micro-crepe structures may have the same roughness profiles even though their mechanical properties are quite different. Of these, it is the micro-crepe structure which is desirable for improving bulk and softness. In contrast, the macro-crepe structure may increase surface roughness to adversely influence bulk and softness.
This suggests that surface roughness determination alone may lead to the wrong conclusion on the mechanical properties such as bulk, softness, and absorbency. It cannot be overemphasized that it should be the micro-crepe structure that should influence such mechanical properties. A literature review suggests that it is only the surface friction which is significant to surface softness.1,5-8) Recently, Park et al. confirmed that adding the surface roughness term to tissue softness does not improve the correlation with the subjective softness evaluation. In addition, replacing the surface friction term with the surface roughness term results in poorer correlation with subjective softness.9)
2.3 Embossing
The main objective of embossing is to increase bulk, softness and absorbency.12,13) In general, however, embossing results in increased surface roughness, or non-uniform bulk. Both micro-scale and macro-scale roughness profiles may be obtained by using different embossing rolls: the former with a micro-embossing roll, and the latter with a macro-embossing roll. The effects of embossing on mechanical properties have not been well characterized.
3. Materials and Methods
3.1 Materials
Three commercial paper towels were used in this study. They are all 2-ply products. Their physical properties are shown in Table 1.
3.2 Methods
3.2.1 Sidedness determination
All three samples are 2-ply products. To measure the degree of the sidedness of each product, the 2-ply product was separated into a single ply. Fig. 1 shows the surfaces of the top and the bottom of the three samples.
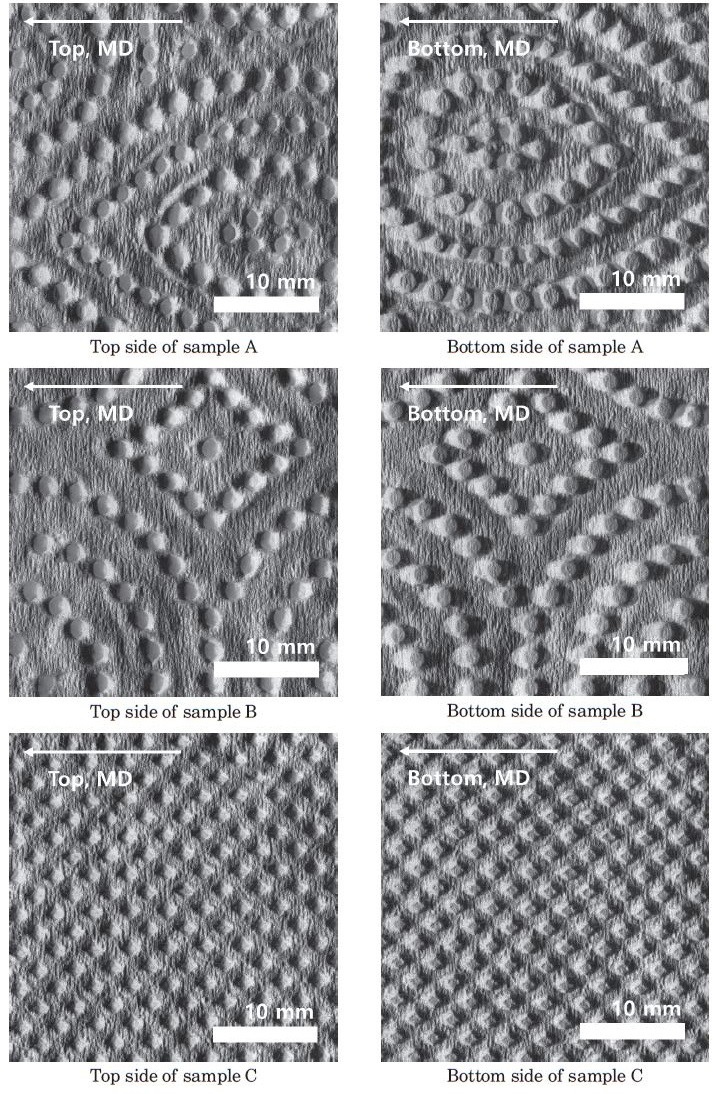
3.2.2 Surface characterization
The surfaces of the top and the bottom sides of each sample were scanned with the surface tester. To examine the sidedness of each two-ply product, the two plies were separated into a single ply. Then, the surfaces of the outside and the inside of the plies were examined.
3.2.3 Surface roughness measurement
A surface roughness/friction tester (Model: KESSESRU) from Kato Tech (Japan) was used for the surface characterization of the paper towel samples. 14) It is capable of measuring surface roughness and surface friction at the same time by scanning the sample surface using a single steel wire with 0.5 mm in diameter. The scanning speed was 1 mm/sec and the scan distance was 20 mm. The contact force of the stylus on the surface was 5 g. These conditions are the same as those used for testing toilet tissue products.9)
Fig. 2 shows a roughness profile of the top side of sample A in the machine direction (MD) as an illustration.
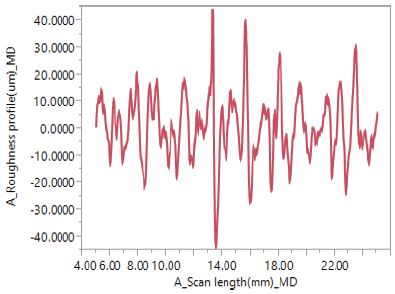
From Fig. 2, SMD is calculated from:
where, SMD = the mean average deviation of a surface profile,
L = scan length, 20 mm,
Z = thickness of the sample at position x,
= mean value of Z.
According to the definition of the ISO standard methods, is defined as the roughness average (Ra).15-17) Accordingly, SMD can be interpreted as the mean deviation from the roughness average, Ra. It is important to note the difference between the two, which has been frequently overlooked.
Note also that the instrument does not measure average thickness. It only measures the variation from the average thickness which is assumed to be zero.
3.2.4 Surface friction measurement
Fig. 3 shows a surface friction profile of the top side of sample A in the MD as an illustration.
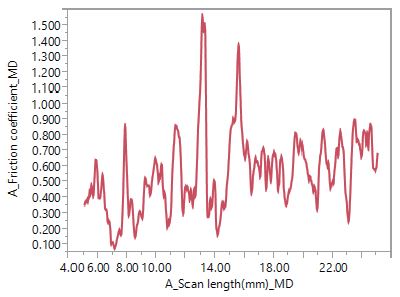
From Fig. 3, MIU () and MMD are calculated from Eq. 2 and Eq. 3, respectively.
where, μ = coefficient of the friction, dimensionless,
MIU = mean value of μ,
MMD = the mean deviation of the coefficient of friction.
4. Results and Discussion
The results are summarized in Table 2. Ten runs were performed for each test. To determine the sidedness of a 2 ply sample, it is separated to two single plies. Then, the top side and the bottom side (Bottom_1 ply) are compared.
Table 2.
The results of SMD and MMD of the paper towel samples
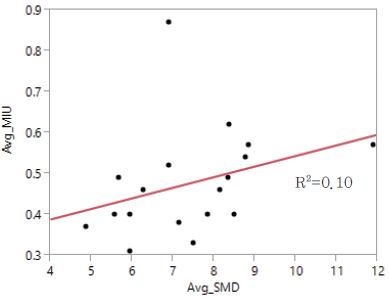
4.1 Relationship between SMD and MIU
Fig. 4 shows a relationship between SMD and MIU. It clearly shows that the correlation is very low, suggesting that these two parameters are not well correlated. This indicates that the surface roughness and surface friction may be independent of each other, requiring separate measurements. It may be misleading the understanding on the surface properties by measuring only one component.
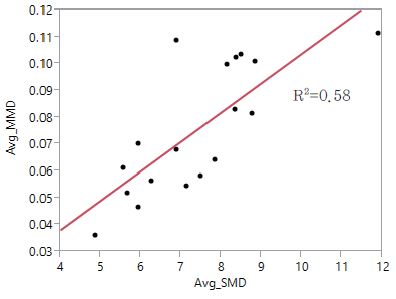
4.2 Relationship between SMD and MMD
Fig. 5 shows a relationship between SMD and MMD. Compared with Fig. 4, the correlation between the two is significantly higher, but still remains relatively poor with R2=0.58. Thus, it can be concluded that the surface roughness component and the surface friction component should be measured separately. Otherwise, it will mislead the understanding of the surface properties.
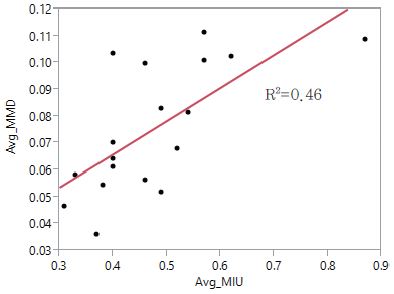
4.3 Relationship between MIU and MMD
Fig. 6 shows a relationship between MIU and MMD. The relationship is also relatively poor between the two. It indicates that MMD is not directly related to MIU. Tissue makers have tried to improve the tissue softness by applying softeners or by lotion treatment. This practice usually results in lowering MIU. However, a lower MIU does not improve the surface softness unless the MMD is lower. Even a tissue having a higher MIU with a lower MMD can be softer than that of a lower MIU with higher MMD.18,19)
In summary, the poor correlations among SMD, MIU, and MMD indicate that these three parameters should be independent of each other. Thus, one parameter may not be replaced with another, and vice versa.
4.4 Determination of the degree of the sidedness
To determine the sidedness of a 2-ply sample, it is separated into two single plies. Then, the top side and the bottom side are compared. From Table 2, sidedness has been determined using the following5):
The results are shown in Table 3. Table 3 shows that a degree of the sidedness determined from Eq. 4 depends on the samples as well as the properties measured. The degree of the sidedness in the MMD seems higher than the others. This suggests that MMD should be the most discriminating in determining a degree of the sidedness of a single-ply product.
Table 3.
Sidedness of 1-ply samples
5. Conclusions
The KES-SE surface tester has been successfully applied for characterizing the surface properties of commercial paper towels. Using a single U-tube piano wire stylus, it was possible to determine the surface roughness and the surface friction at the same time. Surface profiles generally consist of micro-scale and macro-scale. The former may be generated from individual fibers, creping and micro-embossing. The latter may be generated from macro-embossing and printing patterns. It is the micro-scale surface profile that influences the bulk, softness and absorbency. Between the surface roughness component and the surface friction component, the evidence is steadily mounting that the surface friction component is more important to evaluate performance properties; i.e. it is the MMD (Mean deviation from the mean coefficient of friction), not μ itself, which is important. Meanwhile, the surface roughness component may only play a minor role, or even its influence may be safely ignored.
At present, most hygiene papers are produced eliminating the ‘sidedness’, which is the surface roughness profiles between the top and bottom sides. However, it has been suggested that the sidedness may not necessarily be undesirable. The concept of developing a product whose top side has relatively low MMD for handfeel and whose bottom side has relatively high MMD for wiping spills and removing stains is worth further investigation.
It is suggested that the MMD should be the most discriminating in determining the sidedness of paper towel.
