

1. Introduction
Softness is considered one of the important attributes of hygiene paper such as tissue and towel. At present, softness enhancement technology is one of the most protected areas and largely remains proprietary. Thus, very little information on this technology has been publically available.
A literature survey suggests that very few generally accepted and systematic approaches exist for this area. Being subjective in nature, softness attributes have been generally believed to be impossible to evaluate using objective softness test methods. Nevertheless, there have been continuous efforts on developing objective softness test methods due to their outstanding benefits once they are available. In a way, a subjective test method can be considered after-the-fact, a posteriori, which may not be so sufficiently effective for tissue producers to develop new products.
Nevertheless, there have been continuous efforts to develop objective test methods due to their outstanding benefits such as cost-effectiveness, time effectiveness (i.e., going to market faster), quality and statistical process control, and guidance and directions to develop products, etc.1,2)
There have been attempts to develop a single softness-measuring instrument such as Handle-O-Meter, Clark’s softness tester and Brown softness tester. None of these testers, however, have withstood the test time as a softness predictor. It can be safely concluded that no single instrument may be used to evaluate tissue softness.
A comprehensive review on tissue softness evaluation has been performed by Ramasubramanian.3) Since the pioneering work on tissue softness evaluation by Hollmark in Sweden, it is now generally accepted that subjective softness primarily consists of the bulk softness component and the surface softness component.3-7) A critical review of the patent literature further suggests that the bulk softness can be determined from the bulk flexibility which is defined as the inverse of tensile stiffness in a load-elongation curve.7-11) Meanwhile, the surface softness can be determined from the surface properties such as surface roughness and surface friction. The surface friction component seems far more important than the surface roughness. Only the surface friction may be sufficient to determine the surface softness.3,7-11)
2. Subjective softness evaluation method
2.1 Subjective test methods
For subjective test methods, Home-User-Tests (HUTs), Central Location Tests (CLTs), Employee Panel Tests (EPTs), and Sensory Panel Tests (SPTs) have been used.2) A HUT is conducted by the users at home. A CLT is conducted in a location such as a shopping mall. A SPT is conducted in a laboratory by trained panelists. Among them, a HUT should be the most relevant subjective test because it is conducted by users for their actual in-use situations without any constraints. Because of this, however, it is likely to produce the most variability.
One of the challenges in developing an objective softness model starts with the fact that softness is personal perception. It is frequently observed that softness evaluation depends on panelists. The softness evaluation result may also depend on the test method as well. It is not surprising to observe contradictory results among the test methods. For example, the SPT result may contradict the HUT result, and vice versa.
Generally, there is a trade-off relationship that exists between the relevance and the variability for subjective testing. As the degree of the constraints (or restrictions) increases, its variability would be reduced, but becomes less relevant.2,12),13)
2.2 Subjective data acquisition methods
For a subjective test method, three ways of acquiring data have been available.2,11,14)
1) Percentage (%) of the preference in a poll,
2) Rank order, and
3) Rating-Monadic scale or magnitude estimate.
The advantages and the disadvantages of each method has been discussed detail elsewhere.2) It is important to point out that none of these data acquisition methods provide numbers on an interval scale value (ISV) directly. ISV has the characteristics of being linear and continuous on the equal interval scale. It is also referred to as the Thurstone ISV. Thurstone developed “A Law of Comparative Judgment”. Applying Thurstone’s theory, ISV can be derived from paired-comparison tests.15,16) The characteristics of the ISV and the procedures of obtaining ISV from round-robin paired-comparison tests have been discussed in detail by Ko, etc.1)
Most importantly, since the Thurstone interval scale values behave like physical measurement data such as kilogram for weight, meter for length, °C for temperature, and so on. Therefore, mathematical operations such as addition and subtraction are possible. Such interval scale data from subjective evaluation tests has been highly desirable for developing an objective test method, but has not been utilized until the present study.
3. Objective test method development for tissue softness evaluation
An excellent review on tissue softness evaluation has been performed by Ramasubramanian.3) There have been attempts to develop a single softnessmeasuring apparatus. For instance, Handle-O-meter, 17) Clark’s Softness Tester,18) Brown Softness tester,19) and C. H. Dexter softness tester5) have been developed. The out-of-plane elastic modulus has been measured for tissue samples, and a correlation between the subjective softness has been attempted.20)
None of them, however, has withstood the test of time as a softness predictor. They have not been widely used in the industry because they do not offer any more information than that of panel testing. Now, it is widely accepted that no single instrument can be used to measure tissue softness.
3.1 The Hollmark softness model
In early 1980s, Hollmark of the STFI (now Innventia, Sweden) proposed that subjective softness should primarily consist of bulk softness and surface softness.4) Hollmark conducted the sensory panel testing for facial tissues, bathroom tissues and napkins. For Sensory Panel Test (SPT), a rating scale was used. Using regression analysis, the following empirical equation (Eq. 1) was proposed as the tissue softness model:
Where,
Tensile Stiffness = Young’s modulus × True Thickness
Surface Smoothness = Readings from the STFI in-house Surface Tester
The Hollmark’s tissue softness model has the following limitations.
1) The model is specific to the STFI surface tester. If another surface tester would have been employed, the regression equation would have been different.
2) The surface smoothness does not deal with dynamic surface component, i.e., friction.
3) It is very difficult, if not impossible, to measure Young’s modulus for a low basis weight paper since its stress-strain curve is usually non-linear. In addition, it is also very difficult to measure the true thickness which is needed to determine the stress in the stress-strain curve. Here, the stress is defined as the force per cross-sectional area which is the product of the width and the thickness.
4) Lastly, the STFI tester does not work well with embossed or patterned structures where the surface roughness profile various widely.
It is noted that rating data acquisition method was employed for the SPT. If a different data acquisition method had been employed, Eq. 1 would have been different. One of the critical problems with Hollmark’s model has been the lack of the surface friction component for the surface softness.
It has been increasingly recognized that the surface friction should be very important for tissue surface softness evaluation. It may be far more important than the surface roughness.3,7-11) It has been even suggested that the surface friction alone is sufficient for determining the surface softness. 3,7-11)
There appear as many as tissue softness models as the number of the researchers working on this area. Most of the researchers have used statistical approach (i.e., multi-regression) to correlate between physical properties and subjective softness, examining the value of R2.
3.2 Procter & Gamble (P&G) work on tissue softness (bulk flexibility) evaluation
As discussed in the Hollmark’s tissue softness model, it is very difficult to determine Young’s modulus of a tissue since its true thickness needs to be measured accurately which is very difficult to do. To avoid this problem, W. Spendel, et al. has determined the flexibility of a tissue as a measure of bulk softness.8,9) It is defined as the inverse of tensile stiffness in a load-elongation curve from a tensile testing. It is observed that a trade-off relationship between the strength and the bulk softness, however, they do not behave independently, but rather influence each other.
To examine the strength-bulk flexibility relationship, the WABY Factor2,8,9) has been defined as:
It is noticed that the WABY Factor is dimensionless. Since bulk flexibility is inversely related to bulk stiffness which is in turn proportional to the average slope at the load of 20 g/cm. Eq. 2 shows that WABY Factor becomes smaller as the average slope decreases and the tensile strength increases. Accordingly, the WABY Factor would be smaller for the softer and stronger product.
Compared to the Hollmark model which determines Young’s modulus for bulk softness, the P&G model is obviously much simpler and easier to determine. In the patent, the flexibility was determined as a measure of bulk softness. It is the inverse of tensile stiffness in a load-elongation curve. For surface softness, KES-FB4 (Kato Tech, Japan) was modified to handle tissue samples and the friction was determined. For the surface roughness, Human Textile Response (HTR) texture was used.9,17) Another important difference from the Hollmark model has been that the P&G model has included the surface friction component as a measure of the surface softness.9)
3.3 Kawabata testing systems for fabric and non-wovens softness evaluation
At this point, it is worthwhile to discuss some works on tissue softness evaluation using the Kawabata Evaluation System (KES, Kato Tech, Japan). In the early 1970’s the KES was developed by Kawabata to determine handfeel of fabrics and textiles.18,19) The KES consists of the 4 units:
1) FB1 - Tensile/shear tester,
2) FB2 - Bending tester,
3) FB3 - Compression tester, and
4) FB4 - Surface tester.
Using the 4 units, 16 physical properties can be measured to select the variables that have a high correlation with handfeel values. The KES has been widely used, in particular, for the standardization of handfeel in textile industry.19)
As discussed in the P&G Model, however, FB4 had a limited success for measuring tissue softness. For handling tissue samples, Kato Tech introduced a model of KES-SE surface tester.
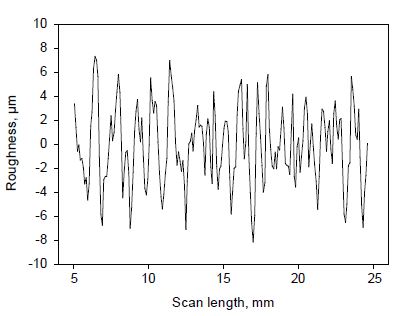
Using the KES-SE surface tester, the surface roughness and the surface friction are determined. 10,11) For the surface roughness, the mean deviation from the average surface thickness (SMD) is calculated from Eq. 3:
where, L is the scan length (mm), Z is the thickness, and is the average thickness.
As shown in Fig. 1, it is important to notice that the KES-SE tester does not provide thickness profile directly, only the roughness profile from the average thickness which is assumed zero.
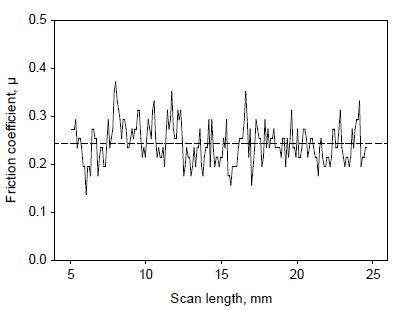
For the surface friction, the mean deviation (MMD) from the average surface friction () is calculated from Eq. 4:
where, L is the scan length (mm), μ is the friction coefficient, and is the average friction coefficient. Fig. 2 shows a surface friction profile of a tissue sample as illustration.
3.4 Georgia-Pacific softness development work
3.4.1 Bulk softness
Georgia-Pacific’s (G-P) work on determining the bulk softness is essentially the same as the P&G work. The only difference is that G-P determines the average slope at 50 g/inch which is equivalent to 20 N/cm.10,11)
3.4.2 Surface softness evaluation
Using the KES-SE surface tester, G-P found that the MMD should be sufficient to correlate with the SPT softness evaluation. Thus, the G-P model replaces the surface roughness in the Hollmark model with the surface friction (MMD).10,11,21) It is critically important to realize that it is MMD, not μ (friction coefficient) itself that influences the surface softness. The softness of a product can be very poor when the MMD is high even when μ is low.
3.5 Kimberly Clark softness development work
3.5.1 Bulk softness
Kimberly Clark’s (K-C) work on determining the bulk softness component is essentially the same as either P&G’s or G-P’s. They determined the average slope of the tensile curve to be between a load of 70 and 157 g per 3 inches (or between 9.2 and 20.6 g/cm). Here the average slope is defined as the stiffness softness component.7) Thus, it is realized that the three methods for determining bulk softness component are very similar that the difference among them may be statistically insignificant.
3.5.2 Surface softness
K-C has determined the surface roughness component using a KES-SE surface tester (Model KES-SE, Kato Tech., Japan). The tester is essentially the same as G-P used, but, K-C measured the MMD only with a U-shaped probe of a single stainless steel wire.7) Yokura, et al. has observed that this probe should be more capable of differentiating tissue products and should have better correlation with subjective evaluation than the conventional multi-probe consisting of 5 single stainless steel wires.21-23)
Beuther, et al. has proposed the tissue softness model as follows:7)
Here OSV represents objective softness value obtained from the SPT. It is not clear whether OSV is an interval scale. GM is the geometric mean of the MD (machine direction) and the CD (cross direction). Eq. 5 may be represented as Eq. 6:
Compared with Eq. 1, the surface Smoothness in Eq. 3 has been replaced by GM_MMD. It clearly shows that the regression formula can be quite different depending on the subjective data scale and testing conditions on the average slope and the MMD.
The Hollmark model and the K-C model suggest that a power law softness model would be of the general form (Eq. 7):
Here, a, m, n can be determined using a regression analysis. It further suggests that the bulk stiffness can be determined from a load-elongation curve from a tensile testing. Surface roughness (SMD) and Surface friction (MMD) can be determined using a surface roughness/friction tester like the KES-SE surface tester (Kato Tech., Japan).
4. New sensory panel test (NSPT)
A new sensory panel test (NSPT) has been developed. As discussed earlier, NSPT intends to provide the relevance like a HUT and the variability like physical tests. The details of the NSPT have been described elsewhere.12,13)
In the study, 7 commercial bathroom tissue rolls, both domestic and imported, were used for NSPT consisting of 100 untrained panelists. Rating, rank order, and paired-comparison methods were used. For paired-comparison methods, both the full round-robin tests (FRRT) and the subgrouping round-robin tests were performed for the 7 samples resulting in 21 pairs and 12 pairs, respectively. The %-preference of each sample was calculated by tallying the preference of each sample by the panelists. For subgrouping test, the 7 coded samples (A-G) were grouped into two following their rank order:
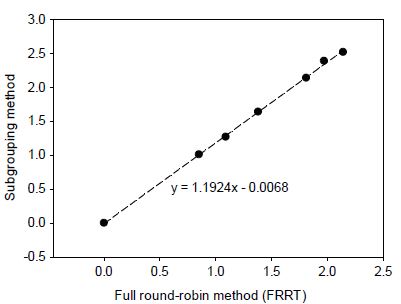
A round-robin paired-comparison tests were performed on each group, resulting in 12 pairs in total. Note that each group has a sample to link with the two groups. Such a sample is called the ‘anchor’. Table 1 shows the Interval Scale Value comparison between the FRRT and subgrouping test method.13)
Table 1.
Interval Scale Values: FRRT vs. subgrouping13)
| Code | FRRT | Subgrouping |
|---|---|---|
| E | 2.14 | 2.52 |
| A | 1.97 | 2.39 |
| G | 1.81 | 2.14 |
| F | 1.38 | 1.64 |
| D | 1.09 | 1.27 |
| C | 0.85 | 1.01 |
| B | 0.00 | 0.00 |
Fig. 3 shows the relationship between the two methods. It shows a great deal of consistency between them. The regression equation in the figure shows that the slope is 1.19 which is greater than one. This indicates that the range of the Z values should be more widely spread out for the subgrouping method than that of the FRRT. This means that the subgrouping test method should be more discriminating though it requires a fewer number of pairs than the full round-robin tests.
5. Physical properties measurements and tissue softness model
5.1 Bulk flexibility (tensile stiffness) test
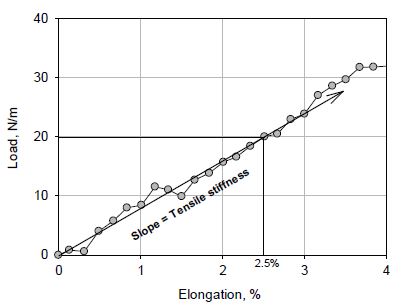
12 commercial bathroom tissue rolls from both domestic and imported were used for both NSPT and physical tests. The 12 samples were coded from S01 to S12.12) Tensile stiffness testing was conducted using a tensile tester (Criterion Model 41, MTS, U.S.A.). Fig. 4 shows the tensile stiffness in a load elongation curve of S10 in MD as an illustration. In the figure, the tensile stiffness is determined as the slope between the origin and the load of 20 N/m.
5.2 Surface roughness and friction
Surface roughness and surface friction of the 12 samples were determined using a surface roughness/friction tester (Model: KES-SESRU, Kato Tech., Japan). Both the machine direction (MD) and the cross-to-the machine (CD) were measured and the geometric mean (GM) of the two direction were calculated. Both the results of the NSPT and the physical properties using 12 commercial bathroom tissue products worldwide are summarized in Table 2.12)
Table 2.
The results of SPT, tensile stiffness (TS) and surface properties of bathroom tissues.
From Table 2, a regression analysis was done among Interval Scale Value (ISV), MMD, SMD, and Tensile stiffness. The following regression model (Eq. 8) has been developed:
or alternatively;
Compared with Eq. 9 for the K-C softness model, the equation is remarkably similar, only difference being the different coefficients.
It is important to point out that other physical properties such as bending stiffness and compressibility may be used in determining the bulk softness instead of the tensile stiffness.24,25) These properties are usually related to each other. For example, Ramasubramanian and Ko have shown that the ball-burst strength can be satisfactorily predicted by the product of the geometric mean of the MD and CD strengths multiplied by the CD stretch.26) Thus, it should be reasonable and technically sound to determine the tensile stiffness, which is inversely related to the bulk flexibility.
6. Conclusions
A new sensory panel test (NSPT) has been developed. It behaves like a Home Use Test (HUT) for the real world and like physical tests for strength and absorbency. The NSPT is capable of generating interval-scale values (ISV) from round-robin paired comparison tests. This capability allows for mathematical operations such as addition and subtraction. It is concluded that tissue softness primarily consists of a bulk softness component and a surface softness component. It is confirmed that the bulk softness component can be determined by bulk flexibility and the surface softness component can be determined by measuring the surface roughness (SMD) and the surface friction (MMD) using a surface roughness and surface friction tester.
The evidence has been steadily growing to support that the surface friction component alone should be sufficient in determining the surface softness component.10,24,25) This suggests that any indirect method of determining the surface roughness may not be particularly useful for estimating the surface softness component. These arguments warrant further investigation.
Lastly, physical measurements such as tensile stiffness and surface roughness and surface friction, which are tangible properties and they depend on the testing conditions. Even an identical sample tested with the same instrument can yield significantly different results. Standardization of test methods for tensile stiffness, surface roughness and surface friction is very desirable in order to develop a tissue softness model which can be accepted universally.
