

1. Introduction
2. Materials and Methods
2.1 Materials
2.2 Experiment procedure
2.3 Mathematical model
2.4 Simulation methods
2.5 Model validation
3. Results and Discussion
3.1 Validation of simulation results
3.2 Electric field distribution
3.3 Temperature field distribution
3.4 Moisture field distribution
4. Conclusions
1. Introduction
With growing concerns about economic, environmental, and social issues, the demand for sustainable packaging solutions has significantly increased. Molded pulp product (MPP), primarily made from natural cellulosic or lignocellulosic fibers, has garnered significant attention due to its renewability, recyclability, and biodegradability. The widespread application of MPP in packaging provides a sustainable alternative to conventional packaging materials.1) However, the production of MPP is an energy- and capital-intensive industrial process, with drying energy costs being 8 to 20 times greater than those for preforming.2) Therefore, the exploration of innovative drying technologies is essential for enhancing productivity, reducing energy consumption, and improving MPP quality.
Microwave drying, an emerging technology, has been successfully applied to various materials, including food,3) wood,4) and coal.5) Compared to convection drying, microwave drying has been shown to reduce drying time by 25–90% and increase the moisture removal rate by 4–8 times.6) Currently, most research has focused on static materials in household microwave ovens.7) However, the amount of microwave energy absorbed by materials is largely influenced by their moisture content. Consequently, moisture loss during drying leads to uneven electromagnetic energy absorption across different regions of the material, ultimately resulting in non-uniform heating in static batch microwave drying systems. In contrast, continuous microwave drying using conveyor belt systems achieves significantly higher efficiency and uniformity.
Vongpradubchai and Rattanadecho8) found that using a continuous microwave dryer to heat wood significantly reduced the drying time, decreasing it by a factor of ten or more, compared to traditional drying methods. Bedane et al.9) compared the effects of radio frequency (RF) thawing on beef blocks under static and moving conveyor belt conditions. The findings showed that the conveyor belt’s movement slightly improved the thermal uniformity of the material. Palazoglu and Miran10) also demonstrated that placing wheat flour on a rotating disc, combined with a conveyor belt could reduce internal temperature gradients and improve overall heat distribution. These studies provide strong evidence supporting the efficiency of continuous microwave drying. Most studies on continuous microwave drying have concentrated on experimental approaches. However, experimental trial-and-error approaches are often challenging, time-consuming, and inefficient.11)
Numerical simulation has emerged as a powerful tool for analyzing and optimizing drying processes, allowing researchers to investigate the complex interactions between electromagnetic fields, heat and moisture transport without the need for extensive experimental trials. Buttress et al.12) created a three-dimensional (3D) model for continuous microwave drying to analyze the propagation characteristics of electromagnetic energy within soil. However, this model did not account for material temperature distribution or the dynamic interaction between the material and the microwave field. Chen et al.13) established a numerical model to simulate the continuous RF drying process of egg white powder as it moves along a conveyor belt, but the dynamic deformation of grid elements over time and space hindered numerical convergence. Pitchai et al.14) proposed a discrete-combined method to improve convergence by dividing the continuous process into manageable parts, thereby enhancing computational efficiency. Chen et al.15) applied this method to simulate the translational motion of food during RF heating, enabling the simulation of electromagnetic field and temperature distributions, but neglecting mass transfer. These findings suggest that, although simulation strategies provide valuable insights into heat, and moisture transport during continuous microwave drying, simulating the motion of materials under electromagnetic fields remains a challenge, particularly for MPP drying.
This study developed a detailed comprehensive 3D model to simulate the continuous microwave drying process of MPP using a discrete-combined approach, with a focus on the spatiotemporal changes in the electric field, temperature, and moisture content. By addressing these knowledge gaps, this study has provided a deeper understanding of the complex heat and moisture transport dynamics during the continuous microwave drying of MPP, and elucidated its key characteristics. Consequently, it could be employed to analyze the unevenness of the microwave drying process further and even enhance the drying uniformity by optimizing the process to circumvent local overheating phenomenon.
2. Materials and Methods
2.1 Materials
The experimental materials for this study were MPP samples from the Wing Fat Molded Fiber R&D Center, China. These samples were composed of 65% bamboo pulp, 35% sugar cane pulp, and additives such as bleaching agents, binders, and moisture-proofing agents. The original dimensions of the MPP samples were 200 mm × 100 mm × 2.4 mm. with an initial weight of 54.00 ± 0.10 g and a dry basis moisture content of 1.40 ± 0.01 g water/g fiber.
2.2 Experiment procedure
This study used a continuous microwave dryer consisting of a drying chamber, magnetrons, a control system, a conveyor belt, and a supporting frame. The geometric model is shown in Fig. 1a. The dryer had overall dimensions of 2000 mm × 300 mm × 300 mm and was equipped with ten waveguides, each operating at 2.45 GHz. Each waveguide, measuring 80 mm × 50 mm × 20 mm, was arranged linearly along the central axis at the top of the drying chamber, as shown in Fig. 1b.
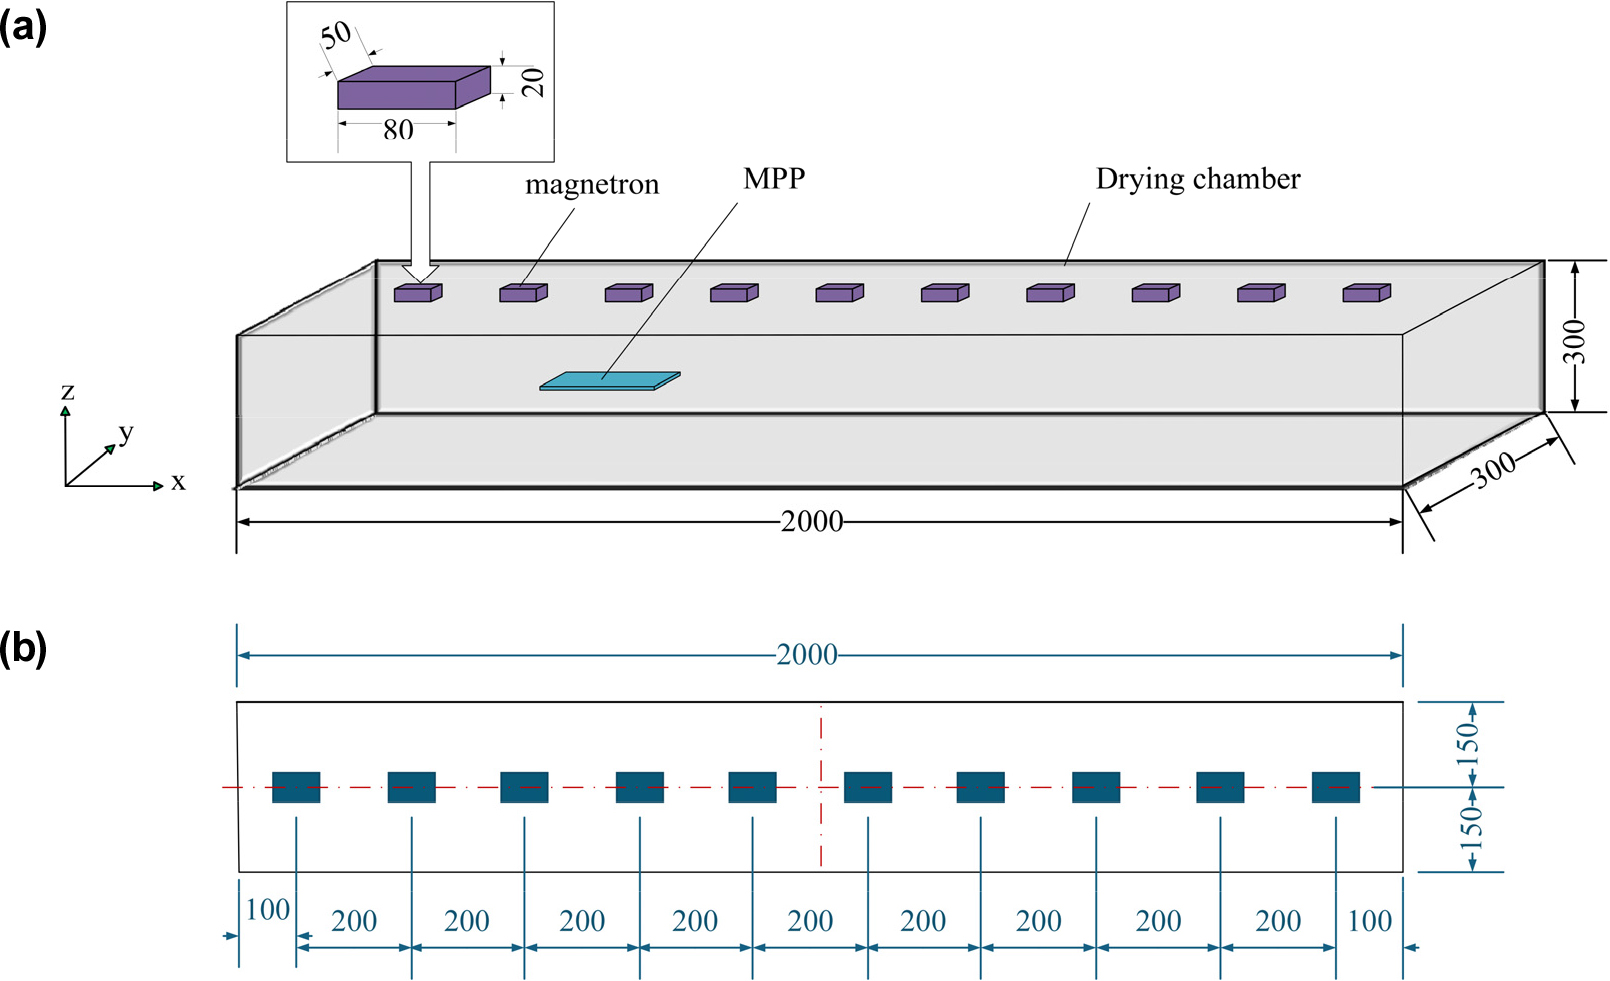
In the experiment, the MPP sample was placed on the conveyor belt, which transported it through the chamber at a constant speed of . To accurately monitor changes during the drying process, sampling windows were placed at 0.2 m intervals along the conveyor belt. At each window, the MPP was periodically sampled for analysis. The moisture content on a dry basis (, g water/g fiber) of the MPP is defined by Eq. [1].
where, is the total mass of the MPP at time (g) and is the mass of dry matter in the MPP (g).
2.3 Mathematical model
2.3.1 Assumptions
The following assumptions were made to simplify the continuous microwave drying process.
• The MPP was assumed to exhibit homogeneous temperature and moisture profiles at the onset of the process.
• The shrinkage of the MPP during the drying process was neglected.
• The MPP was treated as a continuous medium, with each element maintaining local thermal equilibrium at identical positions.
• The model accounted solely for water evaporation during drying.
• Microwave heating and heat transfer were assumed to be absent in the conveyor belt, and the chamber walls are considered adiabatic.
2.3.2 Governing equations
Maxwell’s equations in the frequency domain were used to calculate the electromagnetic field.16)
where, represents the relative permeability of MPP; is the electromagnetic field intensity (V/m); denotes the free space wave number; denotes the relative permittivity; is the vector coefficient; 𝜎 refers to the electrical conductivity of MPP (S/m); is the permittivity of vacuum (8.854 × 10⁻¹² F/m); 𝜔 is the angular frequency (rad/s); represents the speed of light in vacuum (m/s); is the dielectric constant; is the dielectric loss factor.
The microwave volumetric heating, (W/m3), within the MPP is given by Eq. [5].17)
where, is the microwave frequency, 2.45 GHz.
The heat transfer is described by Eq. [6] based on energy conservation and Fourier’s law of thermal conduction.18)
where, 𝜌 represents the density of MPP (kg/m3); is specific heat capacity of MPP (J/ kg·K); 𝜆 denotes thermal conductivity of MPP (W/m·K); is the temperature of MPP (K).
The mass transfer is given by Eq. [7] based on the Fick’s diffusion law.
where, denotes the effective moisture diffusivity of MPP (m2/s) and represents the moisture concentration of MPP (mol/m3).
The dry basis moisture content, is related to the moisture concentration through Eq. [8].
where, represents the molecular mass of water, 0.018 kg/mol.
2.3.3 Initial conditions
At = 0, the model satisfies the following conditions:
where, represents the initial temperature (K) and represents the initial moisture concentration (mol/m3).
2.3.4 Boundary conditions
(1) Electromagnetic field boundary condition
Impedance boundary condition is applied to the walls of both the chamber and the waveguide, as shown in Eq. [12].
where, represents the magnetic field intensity, (A/m).
(2) Heat transfer boundary condition
The bottom of the MPP, in contact with conveyor belt, is assigned an adiabatic boundary condition, as shown in Eq. [13].
The heat transfer boundary conditions for the remaining surfaces of the MPP are provided in Eq. [14].
where, is the convective heat transfer coefficient (W/(m2·K)); represents the environmental temperature, which is 293.15 K; denotes the latent heat of vaporization (J/kg); is the rate of moisture evaporation, calculated using Eq. [15].19)
where, is the pre-exponential factor (1/s); represents the activation energy (J/mol); is the universal gas constant, valued at 8.314 J/(mol·K); refers to the equilibrium moisture concentration (mol/m3).
(3) Mass transfer boundary condition
A no-flux boundary condition is imposed at the MPP-conveyor interface, as shown in Eq. [16].
A forced convection boundary condition is imposed on remaining surfaces of MPP, as shown in Eq. [17].
2.3.5 Input parameters
Table 1 lists the input parameters and additional relevant properties used in the coupled heat and mass simulation.
Table 1.
Parameters and values used for the simulation
| Parameter | Unit | Value | References |
| Conveyor velocity, | m/s | 0.0167 | This study |
| Initial mass of MPP, | g | 54 | This study |
| Relative dielectric constant of MPP, | - | 3 | Zhao et al.20) |
| Reltive dielectric loss of MPP, | - | 0.045 | Zhao et al.20) |
| Relative permeability of MPP, | - | 1 | Ciacci et al.21) |
| MPP electrical conductivity, 𝜎 | s/m | 0 | Ciacci et al.21) |
| Density of MPP, 𝜌 | kg/m3 | 1,125 | This study |
| Specific heat capacity of MPP, | J/(kg·K) | 3,600 | This study |
| Thermal conductivity of MPP, 𝜆 | W/(m·K) | 0.55 | This study |
| Latent heat of evaporation, | J/kg | 2.2 × 10⁶ | Perre et al.22) |
| Activation energy, | J/mol | 2.1 × 10⁴ | This study |
| Pre-exponential factor, | 1/s | 1.197 × 10⁻³ | Shen et al.18) |
| Effective moisture diffusivity, | m2/s | Law et al.23) | |
| Heat transfer coefficient, | W/(m2·K) | 20 | Ni et al.24) |
| Mass transfer coefficient, | m/s | 0.01 | Ni et al.24) |
2.4 Simulation methods
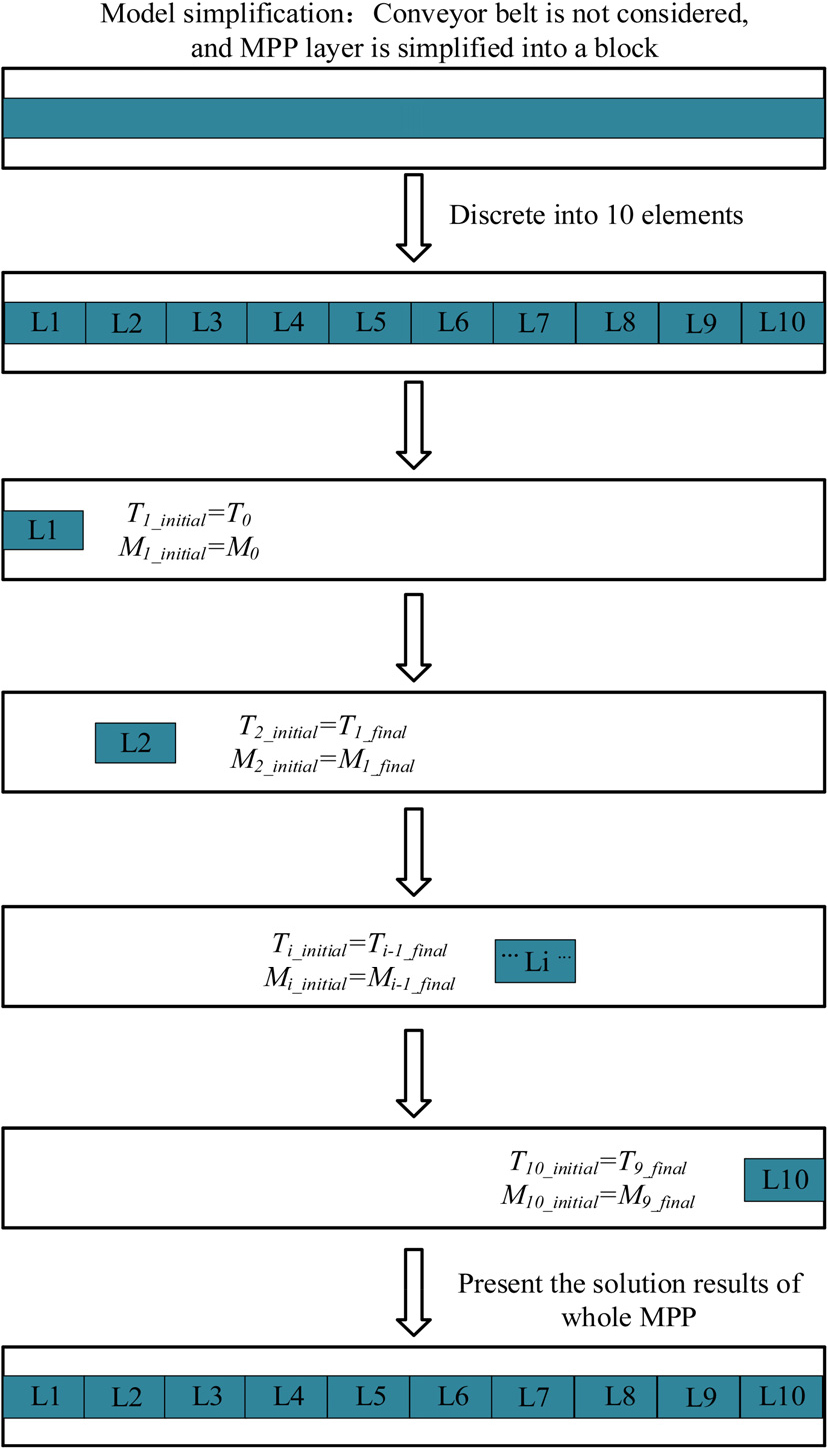
This study employed a discrete-combined approach to simulate the motion of MPP during the continuous microwave drying process, as illustrated in Fig. 2. The movement of the MPP along the conveyor belt was simulated in discrete steps, passing through 10 positions. At = 0, the MPP was positioned at system entry (location L1) and heated for 12 seconds in a stationary state, as detailed by Chen et al.25) The MPP was subsequently advanced to the position (L2) and heated for another 12 seconds, with this process repeated until the MPP exited the system at location L10. At each new position, the sample’s temperature and moisture were initialized according to the results from the previous position, followed by recalculation of electromagnetic field, temperature, and moisture content distributions. This cycle of movement, initialization, and recalculation continued for each discrete location until the final position was reached.
2.5 Model validation
To evaluate the model performance, the moisture content data obtained from experiments were compared to the simulated results, and the coefficient of determination (R2) was used to quantify the fit between the two.26) The R2 value near 1 indicates a high level of agreement between the model and the experimental data, validating the model’s ability to capture the moisture dynamics of MPP during microwave drying. The calculation formula is presented in Eq. [18].
where, represents the measured moisture content in the -th experiment (g water/g fiber); denotes the simulated moisture content in the -th simulation (g water/g fiber); is the average measured moisture content from all experiments (g water/g fiber); indicates the total number of observations.
3. Results and Discussion
3.1 Validation of simulation results
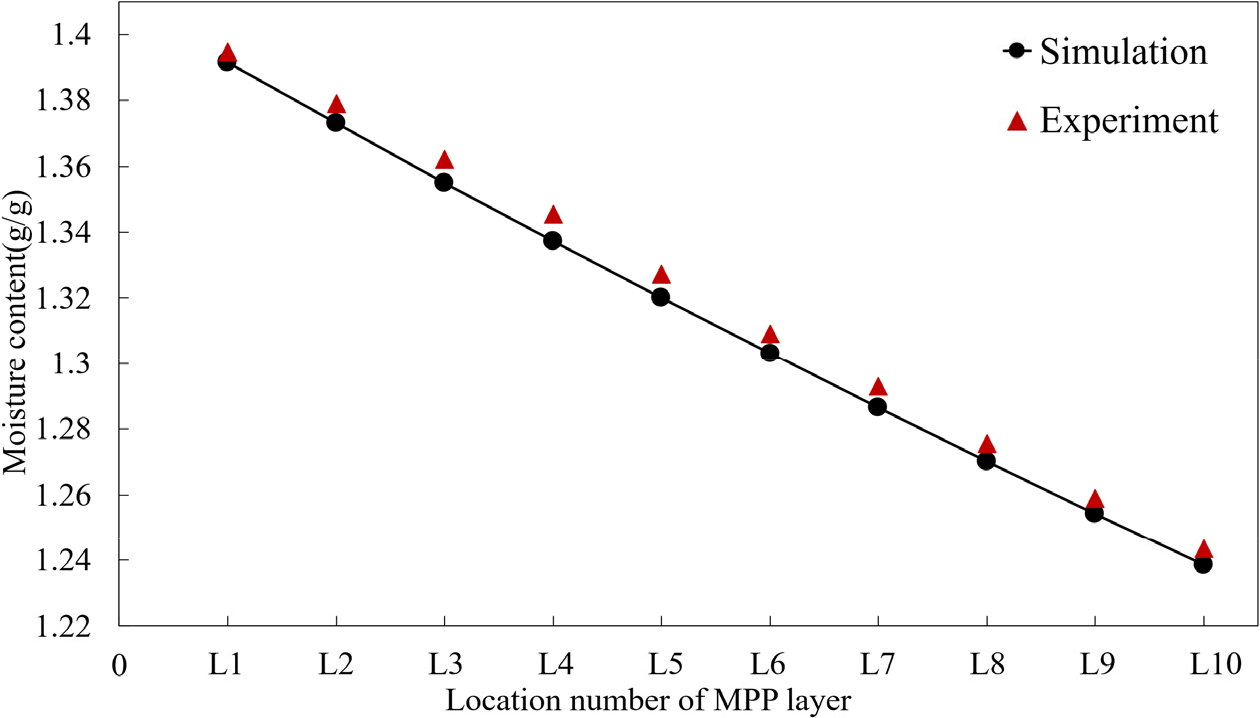
Fig. 3 gives the experimental and simulated moisture content evolution at 300 W. Both the measured and modeled moisture content decreased steadily as the sample passed through the drying chamber. The difference between the two sets of values was minimal, with an R2 of 0.986, indicating that the model accurately captured the moisture content changes during the continuous microwave drying process. Notably, there was little difference between the experimental and simulated results during the initial and final drying stages. However, in the middle drying phase, the simulated moisture content was slightly lower than that of the experimental values. This discrepancy may be attributed to variations in the physical properties of MPP during drying process, such as thermal conductivity, specific heat capacity, and dielectric constant, which were assumed to remain constant in the simulation.
3.2 Electric field distribution
Fig. 4 illustrates the electric field distribution on the MPP at 300 W and 2 minutes drying duration. As the material was transferred through the chamber, an increased electric field intensity was observed at the edges compared to the center. This phenomenon could be attributed to microwave reflections and the superposition of standing waves.27) In addition, the formation of standing wave patterns within the microwave chamber caused noticeable periodic variations in the electric field distribution along the x-axis. Specifically, within the section from 0 m to 0.8 m, the electric field intensity remained relatively stable, with slightly lower values observed at the center compared to the edges. However, in the section from 0.8 m to 1.4 m section, the electric field distribution exhibited more pronounced variations. Localized regions of high electric field intensity at the edges gradually expanded toward the center as the material moved. As moisture was removed from the edges, the high-intensity electric regions progressively propagated inward, resulting in an overall increase in the average electric field intensity. This dynamic interaction between moisture content and the electric field distribution was amplified by conveyor belt motion, which caused energy fluctuations.25) These localized intensity variations were due to changes in material properties, moisture content, and dynamic material motion.28) Therefore, under the combined effects of wave propagation, material dynamics, and drying kinetics, the electric field distribution continuously alternated between uniform and non-uniform states.
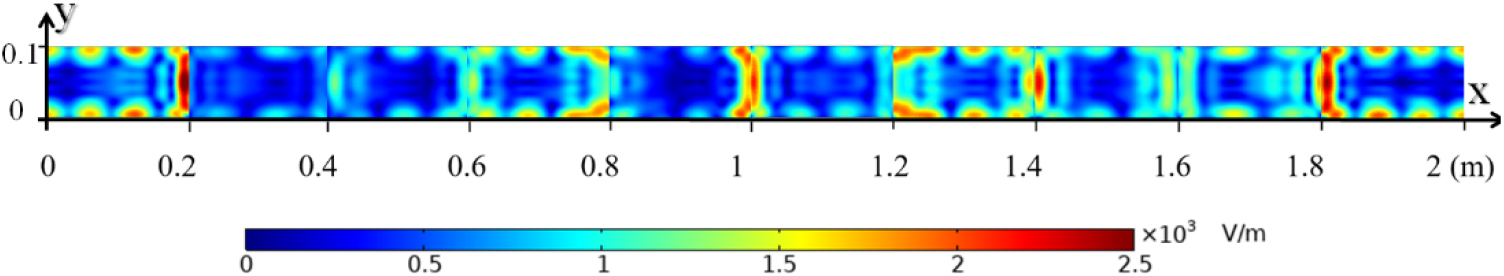
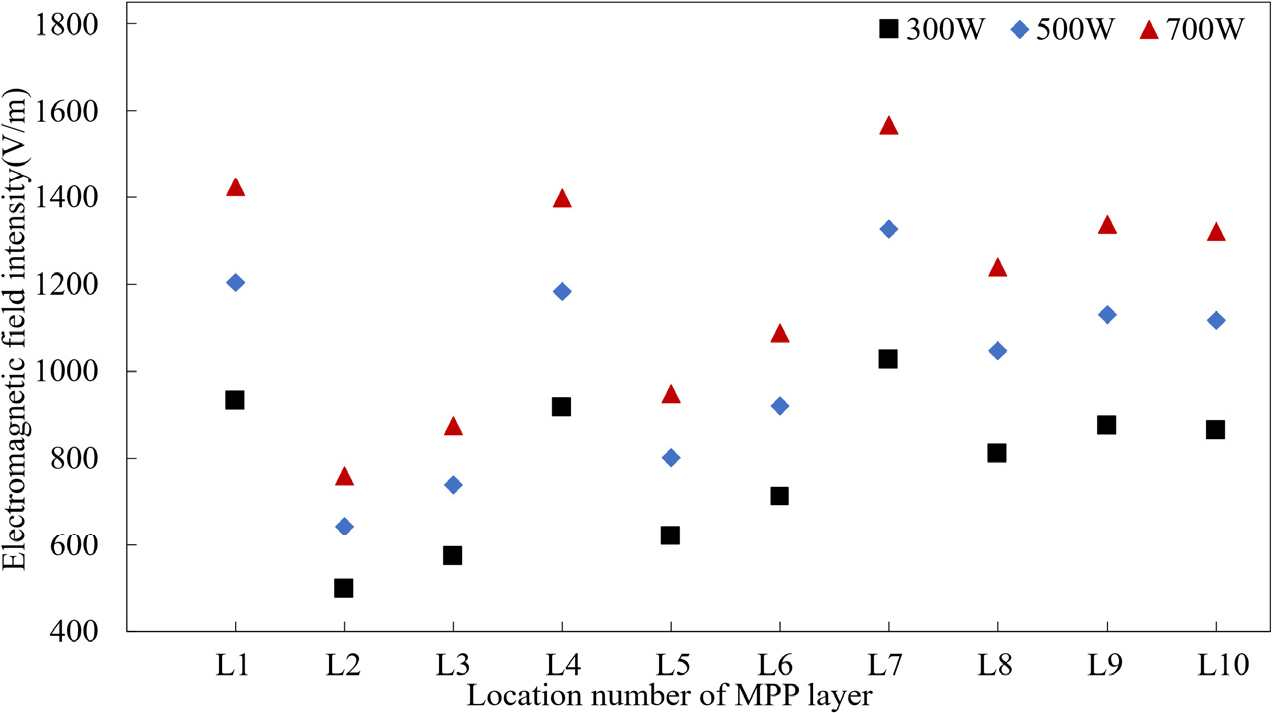
Fig. 5 shows the average simulated electric field intensity on the MPP at different microwave powers. The electric field distribution on the material’s surface exhibited a similar periodic variation throughout the drying process, even under different microwave powers. This periodic behavior corresponded to the standing wave superposition and multi-mode resonance phenomena in the microwave cavities.27) However, as the microwave power increased, the amplitude of the electric field intensity fluctuations became more pronounced. At L1, the higher initial moisture content increased microwave energy absorption, leading to a higher field intensity at this location. L4 and L7 exhibited peak field intensities across all powers, likely due to the superposition effect of standing wave patterns.29) These peaks suggested the possible formation of localized hotspots at these positions, potentially accelerating the drying process in these areas. Such localized energy concentrations underscored the challenge of achieving uniform heating in dynamic microwave drying systems.30) These results emphasized the critical role of spatial energy distribution in influencing drying uniformity and improving overall efficiency.
3.3 Temperature field distribution
Fig. 6 presents the temperature distribution on the surface of MPP during continuous microwave drying at 300 W. The surface temperature displayed significant non-uniformity, with high-temperature regions primarily concentrated along the edges, while the central regions exhibited comparatively lower temperatures. This pattern corresponded to the electric field distribution shown in Fig. 4, where the electric field intensity was stronger at the edge. As the material moved along the conveyor belt, varying electric field intensities resulted in a progressive temperature increase. The maximum local temperature reached 383.0 K at the drying chamber exit. During drying, heat was transferred from the high-temperature regions at the edges to surrounding areas, causing a significant expansion of high-temperature area.31) However, despite the overall temperature increase, the positions of the hot spots remained relatively consistent throughout the process.
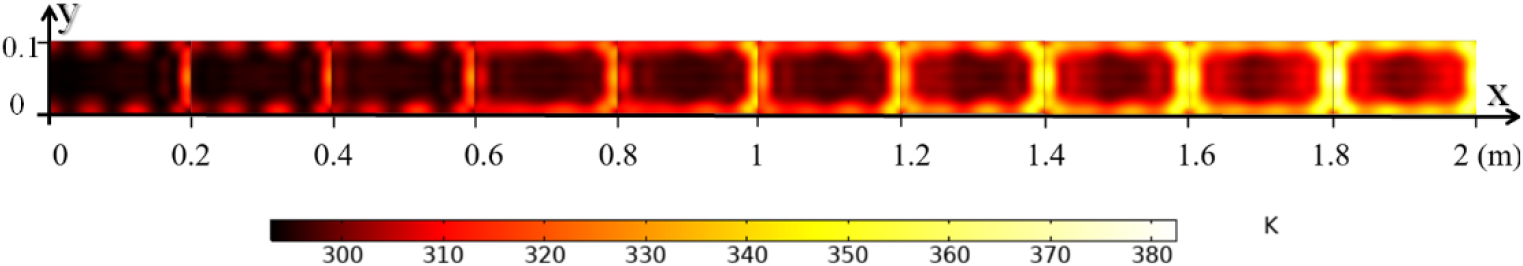
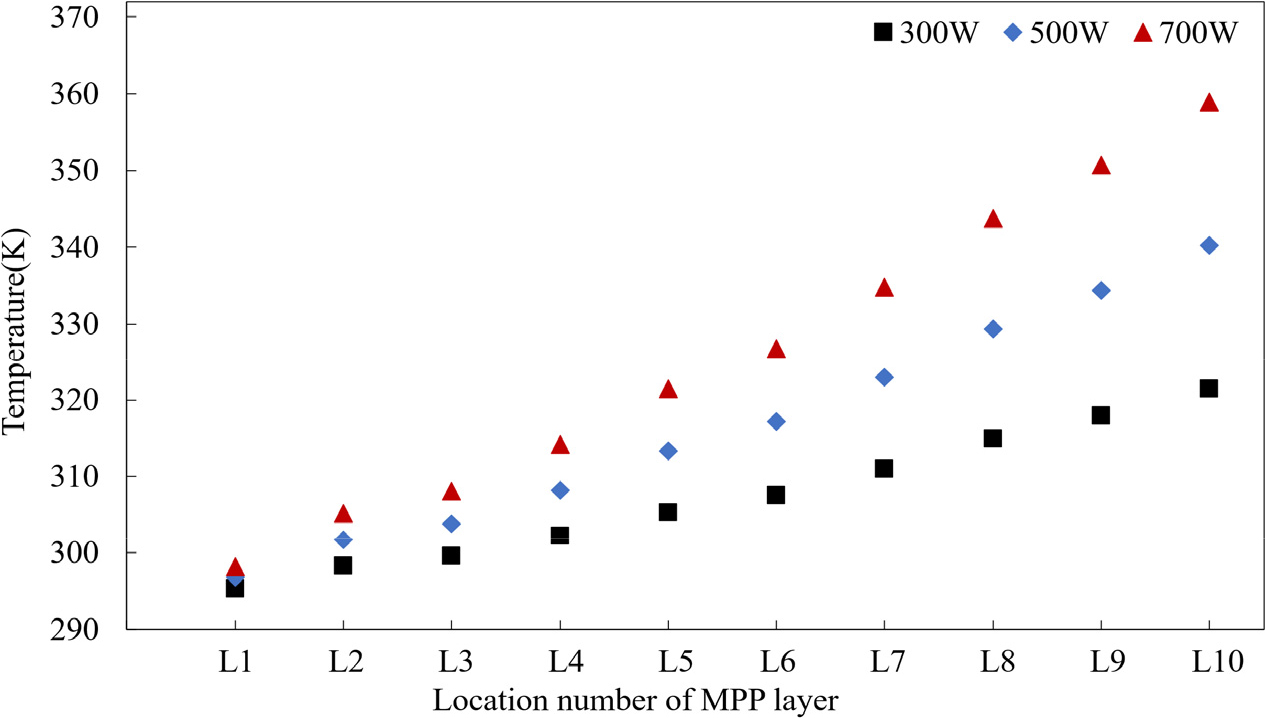
Fig. 7 illustrates the average temperature variation of MPP during the drying process at different microwave powers. The temperature increase followed a similar pattern at each power level, with the final average temperatures reaching 323.7 K, 343.9 K, and 363.9 K at 300 W, 500 W, and 700 W, respectively. In the initial drying stage, the material exhibited high moisture content and low temperature. During this phase, the material absorbed a significant amount of microwave energy, converting it into heat and leading to a rapid temperature rise, with the maximum heating rate reaching 0.39 K/s. As the material progressed toward the midpoint of the drying chamber, the heating rate gradually decreased and then stabilized at an average of 0.20 K/s. This reduction was attributed to the combined effects of decreasing moisture content and rising temperature, which reduced the efficiency of thermal energy conversion.32) In the final drying stages, as the moisture content continued to decrease and structural changes occurred in the porous medium, the heating rate increased again. The average heating rate during this phase was 0.31 K/s, which reflected the complex interaction of heat and mass transfer processes within the drying system.
3.4 Moisture field distribution
Fig. 8 presents the moisture content distribution during continuous microwave drying at 300 W. The material’s moisture content progressively decreased as it moved through the drying chamber, demonstrating the effectiveness of microwave drying in removing moisture. Along the conveyor belt, the moisture content followed a consistent downward trend. The distribution of moisture content at different positions remained relatively uniform, indicating that the dynamic interaction between the continuous motion of the MPP and the microwave field significantly enhanced the uniformity of energy distribution.30) This interaction helped prevent noticeable drying unevenness and the formation of localized hotspots.
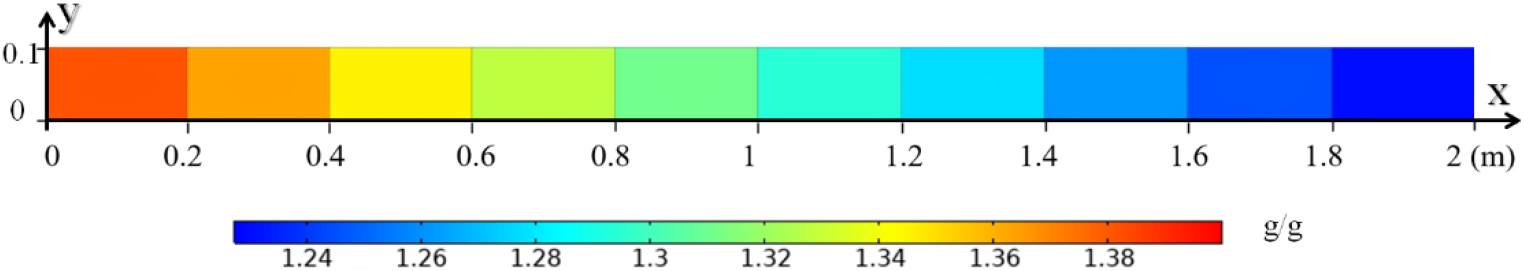
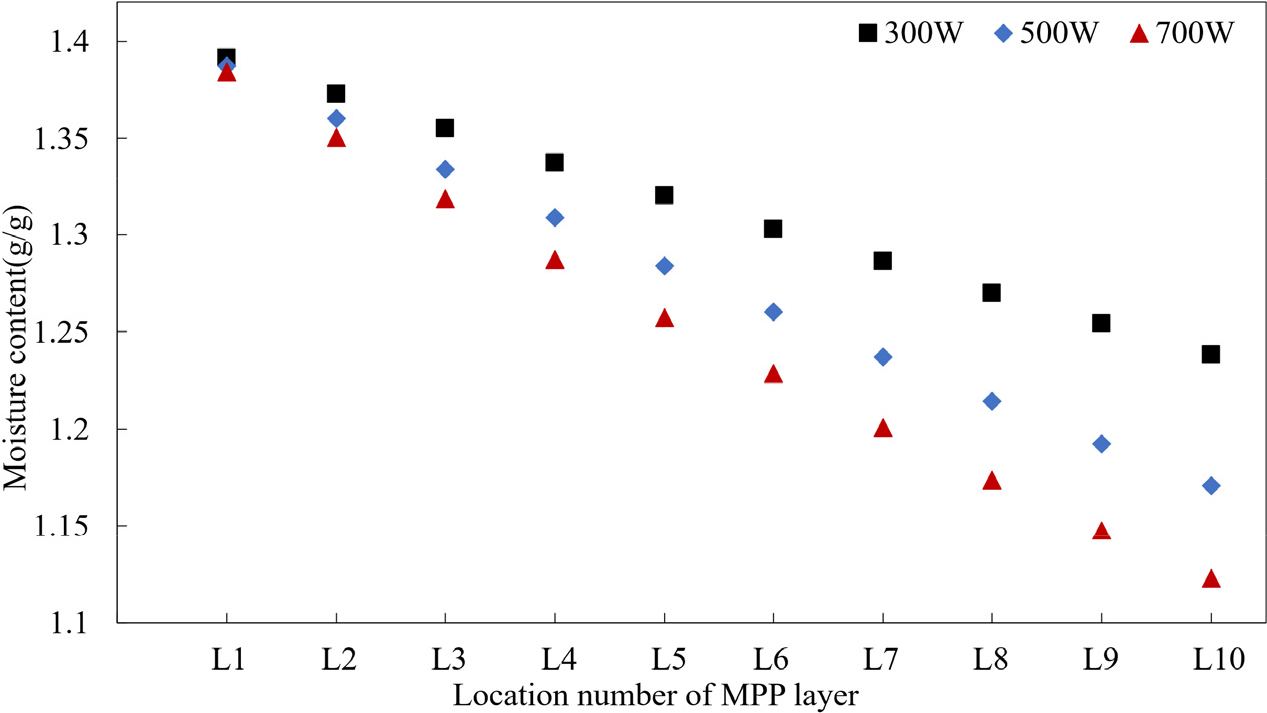
Fig. 9 illustrates the average moisture content of MPP at varying microwave powers. During the continuous microwave drying process, the moisture content gradually decreased along the material’s movement direction, accompanied by an increase in temperature. Moreover, the decreasing trend of moisture content under different powers was relatively consistent, demonstrating a linear decline. Notably, increasing the microwave power from 300 W to 500 W resulted in an increase in the drying rate from 0.085 g/(g·min) to 0.120 g/(g·min), representing a 41.6% improvement in moisture removal. However, further increasing the power from 500 W to 700 W resulted in a modest rise in the drying rate from 0.120 g/(g·min) to 0.145 g/(g·min), corresponding to a 20.8% increase in moisture removal efficiency. This diminishing effect of increased power suggested that, beyond a certain threshold, additional increments in microwave power yielded progressively smaller gains in moisture removal efficiency. This highlighted the need to optimize power levels to balance between energy consumption and drying efficiency.
4. Conclusions
This study developed a comprehensive electromagnetic-heat-mass coupling model to simulate the continuous microwave drying of MPP. A comparison between the model and experimental data revealed a strong correlation, which provided a reliable framework for analyzing the complex dynamics of heat and mass transport in this process. Further simulation analysis showed that microwave reflections and standing wave patterns created high field intensities at the edges of the material. This non-uniformity influenced the temperature distribution, causing localized hotspots at the edges and relatively lower temperatures at the center. However, as drying progressed, heat transfer gradually reduced temperature gradient, resulting in a more uniform temperature distribution throughout the material. Moisture content analysis showed a steady decrease along the conveyor belt, with drying rates of 0.085, 0.120, and 0.145 g/(g·min) at microwave powers of 300, 500, and 700 W, respectively. This study also highlighted that higher microwave power increased the drying rate, although the rate of improvement decreased as the power levels rose. The model provided valuable insights into the interactions between electromagnetic fields, heat transfer, and mass transfer during the continuous microwave drying of MPP. It also has the potential to improve the drying uniformity by optimizing the MPP drying process to circumvent local overheating phenomenon.
