

1. Introduction
Surface properties play an important role in the wet-end chemistry and in the converting processes such as coating, printing, and laminating in the papermaking process. Characterization of surface properties is also important in determining the quality of a paper.
Characterization of surface properties is essential to understanding the surface and interfacial phenomena such as adhesion between a binder and substrate, wetting of a liquid, printability, coating and laminating to make a multiple ply product. Surface properties play a critical role in determining softness of tissue and towel as well.
Surface properties include a surface roughness component and a surface friction component. The former is topographical in nature while the latter is mechanical.
1.1 Surface roughness determination methods
Geometrical descriptions of the surface roughnessprofiles are defined in ISO 42871) and ISO 25178.2)Two types of instruments are available to collectsurface profile data: (1) Non-contact profilometerand (2) Contact profilometer.3)
1.1.1 Non-contact method
A non-contact measuring instrument uses light in place of the stylus used in a contact-type measuring instrument. Light emitted from the instrument is reflected and read, to measure without touching the sample. Many non-contact instruments are commercially available. L&W OptiTopo is one that has been widely used in the paper industry.4)
1.1.2 Contact method
In a contact-type method, the tip of the stylus directly touches the surface of the sample. As the stylus traces across the sample, it rises and falls together with the roughness of the sample surface. This movement in the stylus is picked up and used to measure surface roughness.
The contact method has been used to determine roughness of printing & writing paper. Emveco Smoothness Tester from Lorentzen & Wettre, US5,6) and Talysurf Surface Profiler from Talyor Hobson, Pennsylvania, USA are commercially available.7) These instruments, however, tend to damage the weak samples of hygiene paper such as tissues and paper towels. The resolution is judged too high for characterizing the surfaces of hygiene products. Accordingly, these instruments have been judged unsuitable for characterizing the surfaces of hygiene papers.
Since Kawabata developed a mechanical testing system, known as the Kawabata KES system in 1970’s, it has been widely used to determine the handfeel of fabrics and non-woven substrates.8,9) The Kawabata KES system consists of 4 units: 1) Tensile/shear tester (FB1), 2) Bending tester (FB2), 3) Compression tester (FB3), and 4) Surface tester (FB4). The Kawabata KES system has been established as the Japanese standard method in determining the handfeel of textiles and nonwovens.8)
The surface tester, FB4 unit, has been used for evaluating surface softness of a hygiene paper.10,11) It uses a single wire probe for surface roughness measurements and for a finger-type probe consisting of 10 single wires as shown in Fig. 1.8,12) The instrument was found unsuitable for testing hygiene papers whose sample sizes were too small for the unit.10,11)
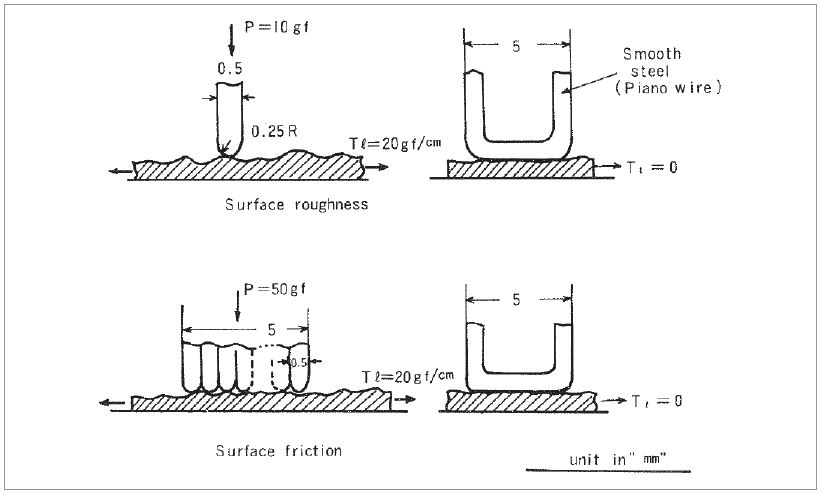
Kato Tech introduced a surface roughness/friction tester, KES-SE surface tester, which was specifically designed for handling tissue and towel samples while using the same stylus as those for the FB4 unit, i.e., a single U-tube piano wire stylus for surface roughness measurements and a finger type probe for surface friction measurements. Using this tester, Dwiggins et al. found that only the mean deviation from the mean average friction coefficient (MMD) matters with regards to surface softness.13,14)
Yokura et al., determined objective hand measurement of toilet paper, based on their mechanical and surface properties using the Kawabata KES System which generated the 16 mechanical and surface parameters. Among them, the surface friction component, MMD, was found to generate the highest correlation (r=-0.827) with the subjective handfeel evaluation. Meanwhile, the surface softness component, SMD, generated a marginal correlation of r=-0.514. They concluded that MMD is the most important property affecting the subjective hand evaluation.15)
Yokura et al. also experimented using a single U-tube piano wire stylus to compare with the finger type stylus for the surface friction measurements (MMD).15) The single U-tube type was found more discriminating than the finger-type by showing a higher correlation with handfeel from subjective testing. This suggests that the single U-tube wire stylus can be used for both surface roughness and surface friction at the same time, thus eliminating the need of using the finger-type probe for surface friction. Yokura’s work has been subsequently validated by others.16,17)
In summary, the Kawabata KES-SE surface roughness/friction tester using a single U-tube piano wire stylus seems to be a promising contact instrument for characterizing the surface properties of hygiene paper. A remarkable feature of this instrument is its capability of measuring the surface roughness component and the surface friction component simultaneously. No other instrument is commercially available nowadays.18)
1.2 Fractal geometry and fractal dimension analysis
Fractal geometry was first coined by Mandelbrot to describe the geometry of Nature that cannot be described in terms of traditional Euclidean geometry. 19) Since his pioneering work on fractals in the 1970s, fractal geometry has been found in abundance in nature, such as mountains, coastlines, clouds, lightning, earthquakes, plants, and even human organs. It seems that fractal geometry in nature is the rule rather than the exception.20-24)
Fractal geometry is characterized by self-similarity over many scales of length (or time), indicating a hierarchical structure consisting of the same shape, but in different scales. Since fractal geometry is commonly found in nature, it is believed that fractal geometry should be the most effective and efficient system for designing and characterizing the structure.
As more insight is gained on the characteristics of fractal geometry, it is increasingly used to characterize surface roughness, porous structures, signal/ noise processing, sensor and monitoring devices in the health and medical industries, computer-aided graphics for the entertainment and film industries, package designs, chemical reactor designs and chemical and polymer synthesis.25-32)
Table 1 lists the potential sources that may contribute to the surface roughness of tissue and towel products. It shows that surface roughness may consist of micro-scale, medium-scale, and macro-scale; from individual fibers to post-processing such as embossing.33)
• Micro-scale (i.e., high frequency, high resolution)
Source: free-end fibers, fiber morphology, Scale: 10-100 μm.
• Medium-scale (i.e., medium frequency, intermediate)
Source: creping, printing on a small scale, Scale: 100-1,000 μm.
• Macro-scale (i.e., low frequency, low resolution)
Source: embossing, printing on a macro-scale, fabrics.
Table 1.
Properties of the samples
| Name | No. of plies | Basis weight, g/m2 | Thickness, mm | Density, g/cm3 |
|---|---|---|---|---|
| K-01 | 3 | 42.2 | 0.179 | 0.236 |
| K-04 | 3 | 47.7 | 0.214 | 0.223 |
| U-01 | 2 | 43.0 | 0.254 | 0.169 |
| U-03 | 2 | 40.1 | 0.198 | 0.203 |
| U-04 | 2 | 47.0 | 0.234 | 0.201 |
| U-06 | 1 | 17.5 | 0.083 | 0.211 |
Several methods are available for fractal dimension analysis: Box Counting Method - Richardson Plot,34) Fast Fourier Transformation (FFT) method22) and Variogram method.24) Selecting a fractal dimension analysis depends on the spacing distance between two adjacent points. For example, if 1,000 points per 1 mm are collected, then the spacing distance is 1 μm. The FFT requires the smallest spacing distance, in the order of 0.01-0.1 μm, corresponding to 10,000-100,000 points/mm.32,33) The Box counting method, also known as Richardson plots is generally used in microscopy or image analysis of the surface images obtained at different magnifications.
The Variogram method is a quantitative statistical method that characterizes the spatial continuity or roughness of a data set using autocorrelation between distances in the surface profile. In statistics, autocorrelation means that the observations are dependent on each other. A higher autocorrelation means a higher dependency. A distance between any two points is called lag, so lag K means any two points whose distance is equal to K. Therefore, a larger K means a larger spacing scale.24)
Militky et al. attempted to perform fractal dimension analysis of the surface roughness data of toilet papers using the variogram method, in order to do this, data were collected using a KES-SE surface tester.33) They realized, however, that a number of data points are only 10 points/mm, corresponding to the spacing distance of 100 μ while approximately 100 points/mm is needed to perform fractal analysis using the variogram method. As a result, they were unsuccessful with fractal dimension analysis on the surface roughness data obtained from the KES-SE Surface Tester.
In the present study, this issue with the KES-SE surface tester has been solved by connecting a data logger to the tester. By doing so, it is possible to collect data points up to 100 points/mm, corresponding to a spacing distance of 10 μm.
2. Materials and Methods
2.1 Materials
Six commercial toilet tissue samples were used for this study. Their properties are summarized in Table 1.
2.2 Surface roughness and surface friction measurements
A Kawabata surface/friction tester (KES-SESRU, Kato Tech, Japan) was used in this study. The Kawabata KES-SE surface tester uses a contact type stylus to perform line scans of all the samples.18)
The standard KES tester has a single U-tube type piano wire stylus that is 500 microns in diameter and provides 150-200 data points per 20 mm scan. This stylus was used to determine the surface roughness and the surface friction measurements simultaneously.
For fractal dimension analysis using the variogram method, about 100 data points/mm are necessary. 33) This problem with the surface tester has been solved by connecting a data logger to the tester which allows collecting data up to 2,000-3,000 data points per 20 mm scan. The testing conditions were as follows:
2.3 Surface roughness determination (SMD)
Fig. 2 is a surface roughness profile of sample K-01 in the machine direction as an example. It is a plot of the roughness against the scan length. In the figure, the roughness average, Ra, was points were collected for a scan length of 20 mm.
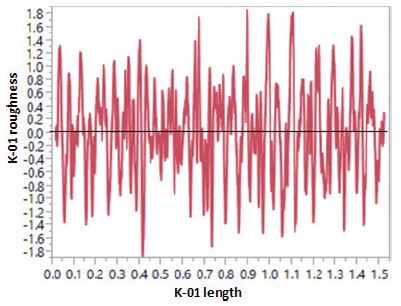
From the surface roughness data, the mean deviation from the average (SMD) was calculated using the following Eq. 1:8,9)
where, SMD = the mean deviation from the
roughness average, μm,
L = the scan length, mm,
Z = roughness at scan length L, μm,
= average thickness, μm.
According to the definition of the ISO standard methods, the average roughness, Ra, is defined as:1-3)
That is, corresponds to Ra. Accordingly, SMD can be interpreted as the mean deviation from the roughness average, Ra. It is important to note the difference between the two, which has frequently been overlooked.
Note that the KES-SE surface tester does not provide the thickness. A thickness tester is necessary for measuring thickness.
The SMD values were obtained for the samples in the machine direction (MD) and the cross direction (CD). Then, the geometric mean (GM) values were determined from the following Eq. 3.
2.4 Surface friction determination, mean deviation (MMD) from the mean coefficient of friction (MIU)
Fig. 3 is surface frictions profile obtained the same U-tube type stylus as used in Fig. 3 for the sample K-01 in the MD direction. It is a plot of the coefficient of friction against the scan length. As for Fig. 3, 2,000 data were collected for the scan length of 20 mm. Fig. 3 is a surface friction profile of sample K-01 in the MD.
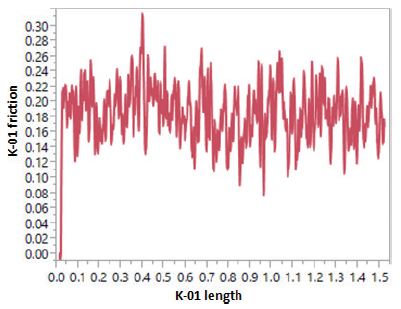
From Fig. 3, the mean friction coefficient (MIU) and the mean deviation of the coefficient of friction (MMD) are calculated as follows:
where, L = the length of measurement,
μ = friction coefficient,
= mean value of μ.
Eq. 4 shows that the surface roughness component, SMD, Z, and have been replaced by the friction component, MMD, μ, and .
The MMD values were obtained for the samples in the machine direction (MD) and the cross direction( CD). Then, the geometric mean (GM) values were determined from the following Eq. 5.
2.5 Fractal dimension analysis using Variogram method
The variogram method was used for fractal dimension analysis.24) The variogram at lag K was determined from the autocorrelation function as follows:24,33)
where, Vk = Variogram at lag k = 15 (default),
rk = the autocorrelation at lag k,
n = number of point in the data set.
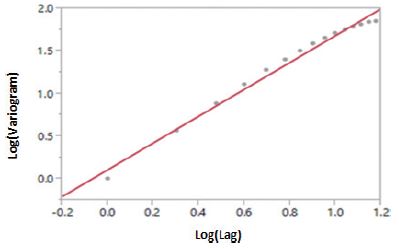
The calculation of sample autocorrelation from the surface roughness and surface friction data from the KES-SE surface tester was performed using the time series analysis in JMP.35) Then, the variogram is plotted against lag K on a log-log scale and a linear regression line is fitted to get the slope, as shown in Fig. 4 for the SMD of the sample, K-01, in MD.
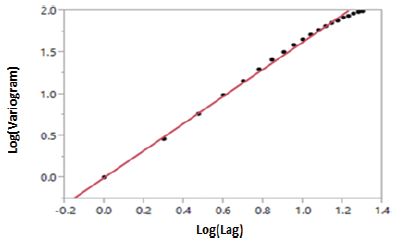
The figure shows an excellent correlation between the two, validating the use of the variogram method for fractal dimension analysis. In the graph, lag K=15 corresponds to 1.18 on a log scale.
From the figure, by linear regression analysis between the two, the following equation was obtained for the SMD of Sample K-01 in the MD:
Then, the fractal dimension (FD) was determined from the following equation.24,33)
In a similar way, the fractal dimension of the surface friction (MMD) of sample K-01 in the MD was determined.
Fig. 5 shows a plot of Variogram vs. Lag on a log-scale of the MMD data of sample K-01 in the MD. It also shows a high degree of linear correlation between the two.
The following regression equation was obtained for the MMD of the sample in the MD.
Then,
In this way, the fractal dimension analyses were completed on the SMD and the MMD of the samples for both the MD and the CD directions.
3. Results and Discussion
The results of the surface roughness component (SMD) and the surface friction component (MMD) of the six tissue samples, calculated from Eq. 1 through Eq. 4 are shown in Table 2.
Table 2.
The results of the SMD and the MMD of the six commercial toilet tissue samples
3.1 Relationship between SMD and MMD
To find the relationship between the SMD and the MMD, a regression analysis was done for the six samples for the MD, CD, and GM (geometric mean), respectively.
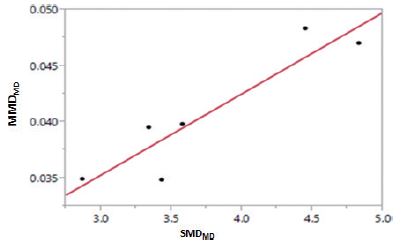
3.1.1 The SMD vs. the MMD in the machine direction (MD)
Fig. 6 is a plot of the SMD vs. the MMD in the MD. It shows relatively high correlation between the two. The following regression equation was obtained:
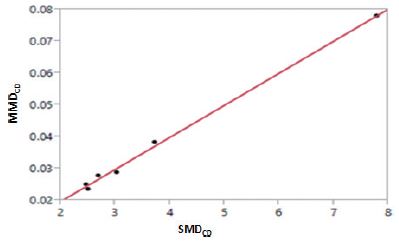
3.1.2 The SMD vs. the MMD in the cross direction (CD)
Fig. 7 is a plot of the SMD vs. the MMD in the CD. It shows high correlation between the two. The following regression equation was obtained:
3.1.3 The SMD vs. the MMD in the geometric mean (GM)
The GM values of the SMD and the MMD were calculated from Eq. 3 and Eq. 4, respectively. Fig. 8 is a plot of the SMDGM vs. the MMDGM. As expected from Figs. 6 and 7, it also shows a high correlation between the two. The following regression equation was obtained:
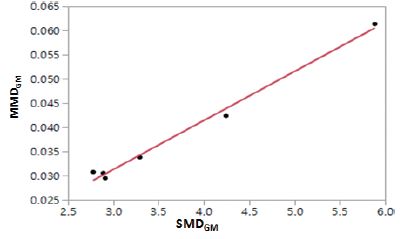
All above figures show that the MMD and the SMD are highly correlated for the samples of Figs. 6-8 examined in the present study.
3.2 Fractal dimension values
Fractal dimension values of the six samples were determined using the Variogram method with lag, K=15 (default). Time series in JMP SAS was used to obtain variogram against lag.35) The results are shown in Table 3.
Table 3.
Summary of the fractal dimension analysis
From Table 3, to find the correlation between the fractal dimension of SMD (FD_SMD) and the fractal dimension of MMD (FD_MMD), a regression analysis was performed for the MD, CD, and GM, respectively.
3.2.1 Fractal dimension values
Fig. 9 shows a plot of the FD_MMD against the FD_SMD in the MD.
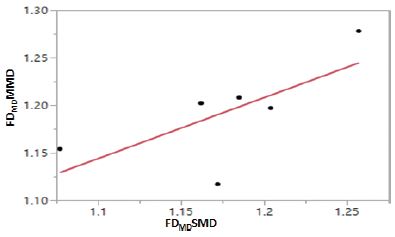
It shows the correlation is poor. The following regression equation was obtained.
This indicates that unlike in the case of the SMD and the MMD, their fractal dimension values are not correlated. The reason is not clearly understood at present.
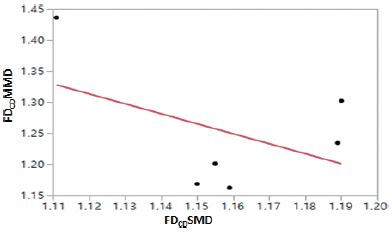
3.2.2 Fractal dimension values of the SMD and the MMD in the CD
Fig. 10 shows a plot of the FD_MMD against the FD_SMD in the CD direction. It shows that the correlation between the two is much lower than that in the MD.
3.2.3 Fractal dimension values of the SMDGM and the MMDGM
Fig. 11 shows a plot of the fractal dimension of GM_MMD (FDGMMMD) against the fractal dimension of GM_SMD (FDGMSMD). As expected from Fig. 2 and Fig. 3, the correlation between the two was very low.
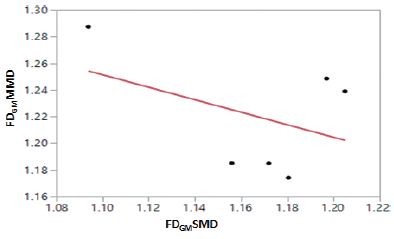
The following regression equation was obtained.
4. Conclusions
The surface roughness and the surface friction components of toilet paper samples were determined using a Kawabata KES surface tester (Model: KES-SESRU) from Kato Tech, Kyoto, Japan. The single U-tube wire stylus was used to determine the surface roughness component (SMD) and the surface friction component (MMD) at the same time.
It was found that the variogram method can be used to determine fractal dimension of the samples. By collecting the surface data obtained of points up to 2,000 points per 20 mm scan length using the tester with a connected logger, the method was successful in performing FD analysis of the SMD and the MMD of the samples.
The results showed that the SMD and the MMD had high correlations indicating that they were dependent on each other for the six samples examined in the present study. The correlations between the FD values of the SMD and the MMD were very low. With very limited commercial samples of the unknown processing information, it was impossible to explain the reason why the correlation was so poor.
Nevertheless, it was encouraging to find that the variogram method could be applied for determining fractal dimension analysis for characterizing the surface properties of hygiene paper such as toilet papers, facial tissues, and paper towels. Until the present study, no work on this area had been available.
