

1. Introduction
2. Configurations of Life-Cycle Assessment in the Pulp and Paper Sector
3. Environmental Performance of Pulp and Paper Production: Selected LCA Case Studies
3.1 Mill- and sector-level environmental performance of pulp and paper production
3.2 Energy supply and mill-level decarbonization options
3.3 Water-related impacts and energy–water linkages
4. Comparative LCA Studies in the Pulp and Paper Sector
4.1 Virgin vs recycled paper and end-of- life scenarios
4.2 Paper versus alternative materials and fiber routes
4.3 Product-level comparisons with paper-based packaging
5. Conclusion
1. Introduction
The increasing urgency of climate change, resource depletion, and plastic pollution has intensified global attention toward renewable and recyclable materials. Among these, pulp- and paper-based materials have long been perceived as inherently “eco-friendly,” largely due to their renewable origin, biodegradability, and widespread recyclability. This perception has positioned paper as a promising substitute for fossil-based plastics in packaging, printing, and consumer products. However, such assumptions often overlook the considerable energy, water, and chemical requirements of paper manufacturing. Large quantities of steam and electricity are consumed during pulping, bleaching, and drying, while wastewater effluents and solid residues can impose significant local environmental burdens. Consequently, a comprehensive and quantitative assessment is necessary to determine whether paper products truly offer lower environmental impacts throughout their life cycles.
Life cycle assessment (LCA) provides a scientifically grounded framework to evaluate the environmental performance of products and processes from raw material acquisition to end-of-life management. Developed under ISO 14040 [1] and 14044 [2] standards, LCA enables the systematic quantification of multiple impact categories—including global warming potential (GWP), eutrophication, acidification, resource depletion, and water use—thereby revealing trade-offs that are not apparent from a single indicator such as carbon footprint alone. In the pulp and paper industry, LCA has evolved from a specialized research method into a mainstream tool for environmental management, eco-label certification, and corporate sustainability reporting. It offers a data-driven means to verify whether the environmental reputation of paper products is justified under real industrial conditions and diverse geographic contexts.
Over the past decade, the scope and sophistication of LCA applications in the pulp and paper sector have expanded substantially. Early studies primarily addressed mill-level efficiency improvements and pollution reduction [3,4,5,6,7,8,9,10,11,12,13,14,15,16,17,18,19], while more recent investigations integrate broader system perspectives—encompassing raw-material sourcing, recycling loops, and end-of-life scenarios [20,21,22,23,24]. Comparative LCAs have also been conducted between paper- and plastic-based packaging to inform substitution strategies and policy decisions on single-use materials [25].
This review aims to synthesize recent trends in LCA studies on pulp- and paper-based materials, mostly focusing on research published between 2015 and 2025. By consolidating insights from the past decade of literature, this paper seeks to provide a comprehensive reference for researchers, policymakers, and industry practitioners striving to validate and improve the environmental performance of pulp- and paper-based materials within the broader transition toward a low-carbon and circular economy.
2. Configurations of Life-Cycle Assessment in the Pulp and Paper Sector
Over the past two decades, a substantial body of LCA research has examined the environmental performance of pulp and paper products across their value chain. To provide a structured overview, we compiled LCA studies published over roughly the last 20 years that focus on pulp production, paper manufacturing, and related paper-based products, and summarized their main characteristics in Table 1. The table reports key elements of each study—goal and scope, system boundaries, functional units, and reference—thereby providing a basis for comparing methodological choices and results across different regions, technologies, and product systems.
Based on Table 1, the LCA literature on pulp and paper products over the past two decades can be characterized along three main dimensions: (i) process and product focus, (ii) system boundaries and life-cycle coverage, and (iii) choice of functional unit and geographical scope.
First, the studies cover a broad range of processes and product types along the pulp and paper value chain. Some contributions concentrate on specific unit operations such as chemical recovery systems in kraft pulping [18], while others adopt a mill- or product-level focus. Several studies analyse national or regional pulp and paper sectors, for example the Portuguese industry, Finnish paper production, and mills in the USA and China [5,13,19,26]. At the product level, printing and writing paper, tissue, packaging grades, and specialty papers are all represented [5,10,13,14,16,20,27,28,29]. A number of studies explicitly compare production routes, such as virgin versus recycled tissue [10], conventional versus high-yield or chemically treated pulps [14,16], or alternative raw materials including bagasse and wheat straw [30,31]. There is also interest in specific product systems like beverage cartons and dissolving pulp, as well as scenarios with increased use of recovered materials [6,21,32].
Second, system boundaries range from narrowly defined gate-to-gate assessments to full cradle-to-grave analyses. Gate-to-gate studies typically examine mill operations or particular subsystems, including chemical recovery, recycled-paper production, kraft-pulp water footprints, dissolving-pulp production, and specialty-paper manufacturing [6,10,11,14,15,18,23,27,28,30]. Cradle-to-gate assessments extend the boundary upstream to raw-material acquisition and energy supply for a variety of products, such as packaging grades, wheat-straw pulp, linerboard, and national pulp and paper chains [16,19,20,26,29,30,31]. A smaller but important group of studies adopts cradle-to-grave boundaries that explicitly include waste management, allowing comparison of options such as recycling, landfilling, and incineration for paper and board products [5,13,21,32,33]. Overall, the literature includes both production-stage and mill-focused assessments and studies that more fully capture downstream waste-management processes.
Third, the functional units are predominantly mass-based, most commonly 1 ton of paper or pulp, which facilitates comparison across studies and product types, except for five studies [10,18,21,27,32]. Some analyses adopt smaller mass units (e.g. 1 kg of waste paper or tissue paper) when focusing on specific waste streams or products [10,27]. A few studies introduce mixed or alternative functional units, such as combining 1 ha of eucalyptus plantation with a single beverage-carton unit to link forest management and product use [32], or leaving the functional unit implicit in broader scenario work on recovered-material use [21]. Geographically, the cases are concentrated in Europe and Asia, with notable examples from Portugal, Italy, Finland, Iran, China, and the USA, reflecting both the regional importance of the pulp and paper sector and the availability of industrial data.
Methodologically, many of the LCAs in Table 1 follow an attributional approach and evaluate multiple midpoint impact categories, with climate-change and energy-related indicators being consistently reported. Some studies extend the scope to include water-footprint metrics, combined energy-and-carbon analyses, and energy-transition scenarios for national industrial chains [15,26]. Several contributions rely on detailed mill data, process-simulation models, and commercial databases to explore technology options and decarbonization pathways. In contrast, relatively few studies explicitly address water scarcity, land-use change, or time-dynamic aspects of emissions.
In summary, the literature mapped in Table 1 documents a broad range of LCA applications in the pulp and paper sector—from unit-process studies to mill-, product-, and sector-level analyses. The studies differ in their choice of system boundaries, functional units, and level of technological detail, and they draw on case studies from several major pulp- and paper-producing regions. Building on this mapping, the following sections provide a more detailed discussion of mill-level pulp and paper production, energy supply configurations, alternative fibers and moulded pulp products, and water-related impacts along the paper life cycle.
Table 1.
Overview of life cycle assessment (LCA) studies in the pulp and paper industry
| Published year | Goal and scope | System boundary | Functional unit | Main findings | Ref. |
| 2003 |
Chemical recovery process in the pulp industry |
Gate-to-gate (recovery boiler and black liquor gasification systems) |
2,500 tons of dry solids in black liquor |
Black liquor gasification system is superior to the conventional recovery boiler system. | [18] |
| 2003 |
Portuguese pulp and paper industry |
Cradle-to-grave (from wood harvesting to waste management) |
1 ton of printing and writing paper |
On-site energy use in paper production and eucalyptus pulp production are major contributors to fossil GHG emissions. | [13] |
| 2004 |
Paper and board packaging waste management options in Italy |
Cradle-to-gate (from waste collection to paper and board production) |
1.17 tons of paper and board packaging waste to produce 1 ton of paper and board for packaging |
Energy recovery from waste paper is preferable to recycling or landfilling in Italy | [20] |
| 2009 |
Moulded pulp production systems for industrial packaging in China |
Cradle-to-gate (from raw material collection to moulded pulp production) |
1 ton of moulded pulp product |
Atmospheric emissions, landfill waste, and the resource- and impact-intensive drying stage are the main environmental hotspots. | [11] |
| 2010 |
Impact of paper recycling on energy consumption and CO2 emissions |
Cradle-to-grave (from raw material collection to waste management) | 1 ton of paper production |
Paper recycling has a positive effect on energy intensity and CO2 emissions over the full life cycle | [33] |
| 2011 |
Papermaking process in Iran, focusing on bagasse as a raw material |
Cradle-to-gate (office paper production) | 1 ton of paper production |
For global warming, bagasse gives the lowest impact among all input types | [30] |
| 2012 |
Printing and writing paper production from conventional and high-yield pulp |
Cradle-to-grave (from wood harvesting to waste management) |
1 ton of printing and writing paper |
Nanoparticle-coated recovered-fiber paper delivers the largest wood, energy, and GHG savings. | [16] |
| 2012 |
Comparison of waste paper management options |
Cradle-to-gate (from raw material collection to paper production) |
1 kg of waste paper treated |
Bioethanol production from waste papers is generally environmentally favorable option compared with recycling or incineration. | [27] |
| 2013 |
Comparison of tissue paper production from virgin pulp and recycled waste paper |
Cradle-to-gate (from raw material collection to paper production) |
1 kg of finished tissue paper |
Producing tissue from recycled waste paper instead of virgin pulp cuts cradle-to-gate GHG emissions by about 30%. | [10] |
| 2017 |
Conventional paper production and paper production from chemically treated wood waste |
Gate-to-gate (raw material processing and paper production) | 1 ton of paper production |
Paper production from chemically treated wood waste shows reduced impacts on human health compared with conventional production | [14] |
| 2018 |
Energy- and carbon-coupled water footprint analysis for kraft wood pulp paper production |
Cradle-to-gate (paper production from wood-chip preparation to paper production); gate-to-gate (energy and alkali recovery system, wastewater treatment) |
1 ton of air-dried kraft wood pulp |
Carbon coupled water footprint analysis were conducted for five Kraft pulp papers | [15] |
| 2018 |
Environmental impacts associated with paper production in Finland |
Cradle-to-grave (from raw material collection to waste management) |
1 ton of paper production (67% office paper, 33% magazine paper) |
Most of the resulting impacts are caused by the industrial production phase. In particular, pulp production process generates the main loads | [5] |
| 2018 |
Wheat straw-based pulp making in China |
Cradle-to-gate (including straw transportation, pulping, bleaching, alkali recovery, energy production, and wastewater treatment) |
1 ton of air-dried bleached pulp produced from wheat straw |
Wheat straw-based pulp making generally has higher environmental impacts than wood-based or recycled pulp, mainly due to higher energy and chemical requirements | [31] |
| 2019 |
Increased use of recovered materials in the US pulp and paper industry |
Cradle-to-grave (from raw material collection to waste management) | Not explicitly stated |
Raising recycled content in U.S. containerboard only delivers large net GHG savings when marginal recovered fiber comes from additional domestic collection rather than diverted exports | [21] |
| 2020 |
Pulp and paper mills in the USA |
Cradle-to-gate (wood procurement, upstream production of materials, transportation, pulp and paper production) | 1 ton of paper production |
An average ton of paper emits 942 kg CO2-eq, with fuels (especially natural gas and coal) dominating GHGs across grades, large variability within and between grades, and biogenic CO2 emissions exceeding all fossil GHGs | [19] |
| 2020 |
GHG emissions of the pulp and paper industrial chain in China, focusing on energy-transition scenarios |
Cradle-to-gate (from raw material collection to paper production) | 1 ton of paper production |
For China’s pulp and paper industry, life-cycle GHG emissions average about 2.6 t CO2-eq per ton of paper, are dominated by coal-based process energy | [26] |
| 2021 |
Eucalyptus pulp-based beverage carton |
Cradle-to-grave (from raw material collection to waste management) |
1 ha of eucalyptus plantation, 1 unit of beverage carton |
Time-dynamic LCA of a eucalyptus-pulp beverage carton finds that fossil value-chain emissions dominate and biogenic carbon plays only a minor role | [32] |
| 2021 |
Effects of energy supply on recycled paper production |
Gate-to-gate (including paper/cardboard recovery, paper mill operations, wastewater treatment) |
1 ton of recycled paper production |
Natural-gas-based energy use dominates impacts, cogeneration (CHP) is preferable to grid electricity plus boiler, chemicals and production waste are secondary hotspots, and results are sensitive to the natural-gas import mix | [23] |
| 2022 |
Dissolving pulp production |
Cradle-to-gate (including wood sourcing, transportation, pulp production, and upstream processes for chemicals/energy) |
1 ton of air-dried wood pulp |
Biomass feedstock directly affects the environmental impacts of dissolving pulp | [6] |
| 2023 |
Specialty paper production |
Cradle-to-gate (from raw material collection to paper production) | 1 ton of paper production |
Purchasing green electricity and implementing rooftop photovoltaics are the most cost-effective measures to reduce carbon footprint | [28] |
| 2025 |
Decarbonization of linerboard production |
Cradle-to-gate (from raw material collection to paper production) |
1 ton of linerboard production |
Graphene oxide membranes for black liquor and condebelt drying were the most effective measures to reduce GHG emissions. | [29] |
3. Environmental Performance of Pulp and Paper Production: Selected LCA Case Studies
3.1 Mill- and sector-level environmental performance of pulp and paper production
A first group of studies assesses the environmental performance of pulp and paper production at the level of individual integrated mills or entire national sectors. Together, these case studies illustrate how process integration, fuel mix, and product portfolio shape the overall carbon footprint and other impact categories of contemporary pulp and paper systems.
In the Nordic context, Corcelli et al. [5] provide a detailed cradle-to-gate and cradle-to-cradle LCA of an integrated Finnish kraft pulp and paper mill (Stora Enso Veitsiluoto), a facility that belongs to a sector responsible for nearly half of Finland’s industrial energy use. The functional unit is 1 t of paper (67% office paper, 33% magazine paper) produced predominantly from virgin chemical pulp, assuming that 1 t of recovered paper substitutes 0.8 t of virgin paper. Across ten impact categories considered, pulp and papermaking together are the dominant contributors, with their impacts largely driven by electricity and steam demand in pulp and paper productions, whereas the contribution of most process chemicals is comparatively minor.
A key insight from this case study is that pulp production is simultaneously the most energy-intensive life-cycle stage and a major producer of renewable energy. As shown in Fig. 1a, pulp production has the highest positive contribution to gross energy use, reflecting the large steam and electricity demand of digesting, chemical recovery, and bleaching. However, on-site “energy production in situ” from black liquor and wood residues appears as a large negative bar, because the mill’s CHP system exports energy that displaces external fossil-based supply. When this internal energy recycling is accounted for, the net external energy requirement of the whole paper system is much smaller than suggested by gross energy use alone. In other words, the Finnish pulp and paper sector is an energy-intensive industry, but at the same time acts as a significant producer of renewable energy for itself and, in some cases, for the surrounding energy system.
The same pattern is reflected in the greenhouse-gas profile in Fig. 1b. Pulp and paper production show the largest positive contributions to GHG emissions, driven by high heat and power demand and, to a lesser extent, chemical production and wastewater treatment. Yet the in-situ energy production stage again exhibits a strong negative contribution, representing avoided fossil CO2 from grid electricity and external heat that would otherwise be required. End-of-life management can also yield net negative emissions when high recycling rates and energy recovery from wastes are modelled instead of landfilling, where methane emissions would dominate. As a result, although individual unit processes within pulping and papermaking are clear hotspots, the cradle-to-cradle balance for several impact categories (including GWP) becomes close to zero or even net-beneficial once avoided burdens from biomass-based cogeneration and recycling are included.
Taken together, the Finnish mill case underlines that the environmental performance of pulp and paper systems cannot be judged solely from their gross energy consumption or process-level emissions. Pulp and paper production remains the main hotspot for both energy use and GHG emissions, but mill-integrated bioenergy systems and high end-of-life recycling rates can substantially offset these burdens. This dual role—as a large energy user and, at the same time, a producer of renewable energy and secondary raw materials—explains why pulp and paper mills can approach net-zero or even negative cradle-to-cradle climate impacts, and it points to the importance of preserving and strengthening internal energy recovery and waste-valorization strategies in future decarbonization plans.
While Corcelli et al. [5] focus on a single integrated mill, Tomberlin et al. [19] extend the analysis to the entire U.S. pulp and paper industry. Using production-line-level data from 252 mills and 865 product lines, they perform a cradle-to-gate carbon footprint for 2018 production. U.S. mills produced 84.4 Mt of pulp and paper associated with 79.5 Mt of fossil GHG emissions and 104 Mt of biogenic CO2. On a production-weighted basis, the average carbon intensity is 942 kg CO2-eq per tonne of product, with large variation across grades (≈608–1,978 kg CO2-eq·t-1). Decomposition by life-cycle stage shows that fuels are the dominant source of GHG emissions (about 50% of the total), followed by purchased electricity (24%), wood procurement (10%), transportation (10%), and upstream chemical production (6%) (Fig. 1c). This hierarchy of contributions—energy-related inputs clearly outweighing the relatively small share from process chemicals—is consistent with mill-level LCAs such as Corcelli et al. [5], where electricity and steam demand in pulping and papermaking drive most midpoint impacts while chemicals play a secondary role.
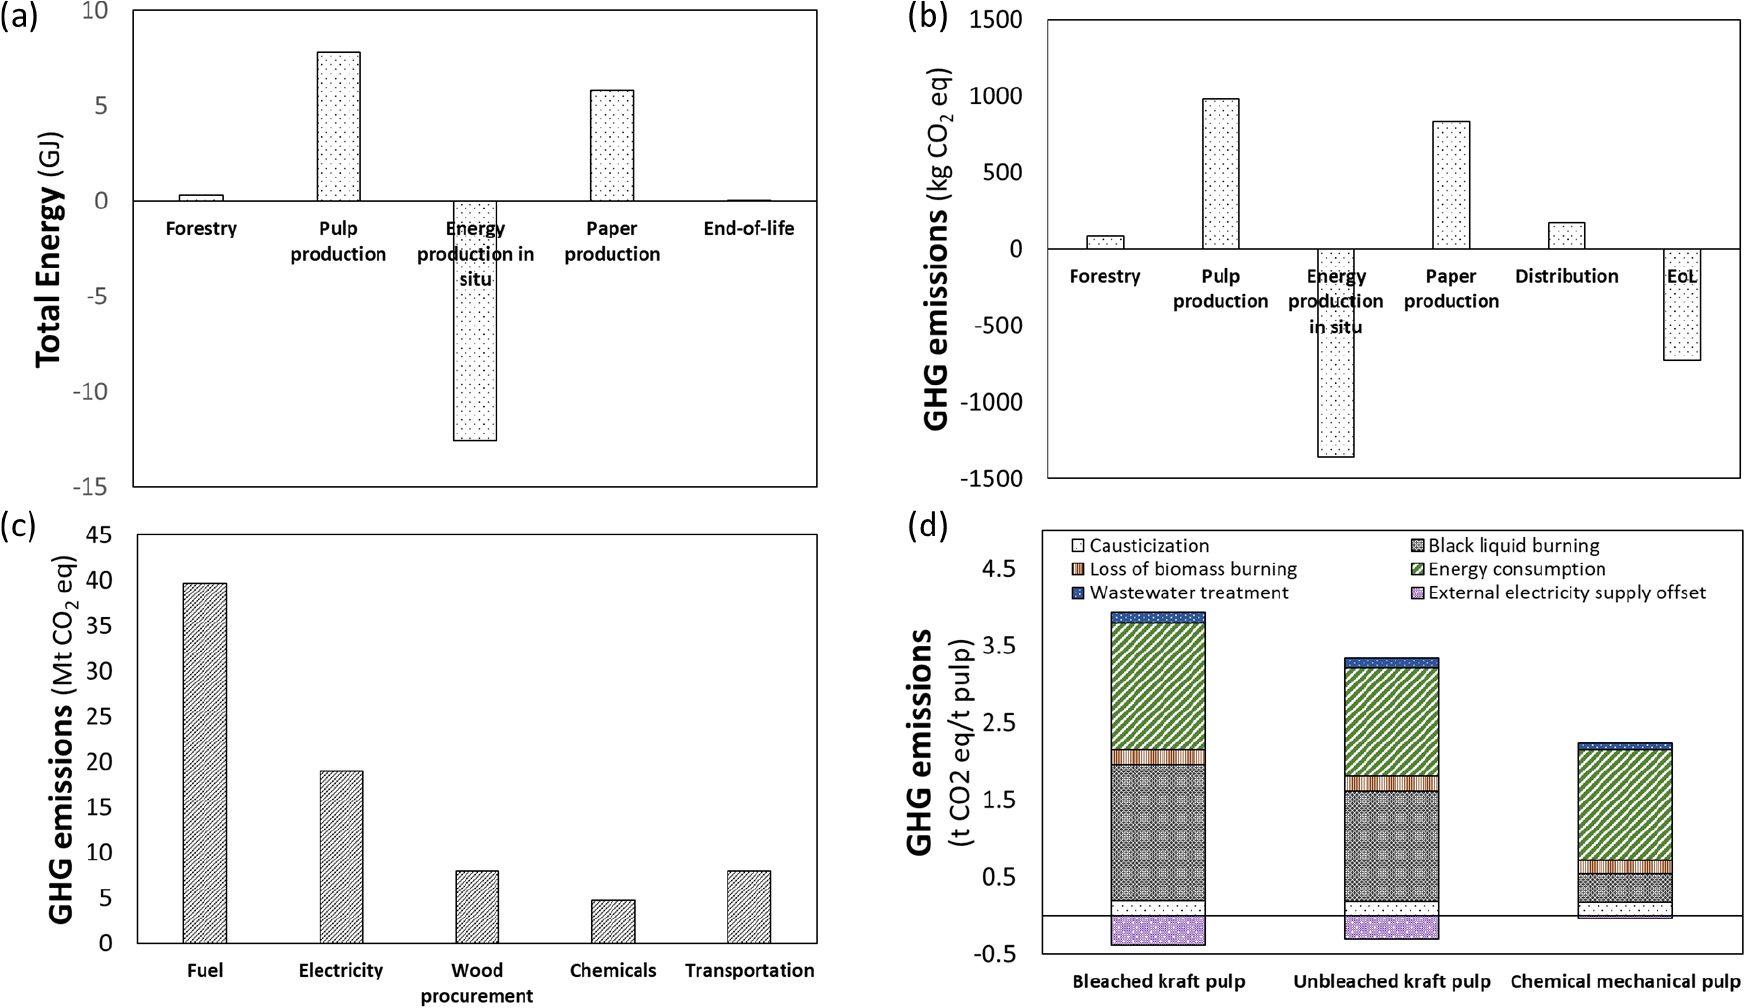
Fig. 1.
Energy use and greenhouse-gas emissions in contemporary pulp and paper systems, based on selected LCA case studies. (a) Life-cycle stage contributions to total energy demand for 1 t of paper from a Finnish integrated kraft pulp and paper mill (based on Corcelli et al. [5]); negative values for “energy production in situ” reflect energy exported from biomass-based cogeneration. (b) Corresponding contributions to life-cycle GHG emissions (kg CO2-eq); negative values for “energy production in situ”. (c) Decomposition of fossil GHG emissions from the U.S. pulp and paper industry in 2018 by major sources (fuels, purchased electricity, wood procurement, chemicals, transportation), based on Tomberlin et al. [19], highlighting the dominance of fuel and electricity over other upstream inputs. (d) Breakdown of cradle-to-gate GHG emissions (t CO2-eq·t-1 pulp) for bleached kraft pulp, unbleached kraft pulp, and chemical-mechanical pulp in a Chinese specialty paper mill, showing contributions from causticization, loss of biomass burning, wastewater treatment, black-liquor burning, on-site energy consumption, and the offset from exported electricity (based on Lai et al. [28]).
Biogenic CO2 emissions from combustion of pulping liquor and other biomass streams actually exceed fossil GHGs in several product categories, underscoring the importance of biogenic-carbon accounting in LCAs of the sector. Within fuel-related fossil GHGs (i.e., excluding biogenic CO2), natural gas provides about 54% and coal about 27%, indicating considerable potential for decarbonization through fuel switching and efficiency improvements. Tomberlin et al. [19] also highlight large within-category variability in GHG intensity across mills and product lines, with particularly high values for specialty grades and tissue (often smaller mills relying more heavily on fossil fuels and purchased electricity) and lower values for large-scale board grades with extensive biomass-energy integration. These results suggest that mitigation opportunities are highly site- and grade-specific, involving combinations of fuel switching, on-site power generation from low-carbon fuels, and targeted energy-efficiency upgrades in drying and powerhouse systems. For detailed numerical results by grade, breakdowns by fuel and electricity source, and statistical distributions of GHG intensity across U.S. mills, readers are referred to Tomberlin et al. [19].
At the enterprise level, Lai et al. [28] evaluate cradle-to-gate carbon footprints (CFs) and mitigation pathways for a Chinese specialty papermaking enterprise producing fine-grammage products (writing, release, lining, and technical papers) on three paper machines. The system boundary includes forest cultivation and harvesting, upstream pulping, papermaking, plant-level carbon sinks, and transportation. Using real-time production data and regionalized emission factors for Jiangsu’s coal-dominated energy mix, the authors report product carbon footprints between 0.95 and 1.83 t CO2-eq·t-1 paper, with a mill-wide average of 1.26 t CO2-eq·t-1—advanced by Chinese standards but generally higher than the best-performing Nordic or Brazilian mills.
Pulping is identified as the dominant hotspot (~66% of total CF), followed by papermaking (~30%), largely reflecting high electricity and steam demand, agreeing with the results from the Finland mill data [5] and US pulp and paper industry [19]. Product grammage and pulp type are additional key drivers: low-grammage papers (<40 gsm) show particularly high footprints due to low yield and complex processing, whereas high-grammage products (>130 gsm) have lower energy use but higher pulp consumption. Substituting bleached kraft pulp with higher-yield unbleached kraft and chemical-mechanical pulp can reduce footprints for some grades, as CMP has both higher pulp yield and lower GHG emissions per tonne of pulp (Fig. 1d).
Scenario analyses to 2050 further suggest that combinations of process-level energy-efficiency measures and increased use of green electricity (purchased green power and rooftop photovoltaics) are necessary to approach, but not fully reach, near-zero product carbon footprints under current technology and energy-system assumptions. Overall, Lai et al. [28] demonstrate that for specialty paper mills, product-level carbon footprints are strongly shaped by grammage, pulp type, and energy mix, and that cost-effective decarbonization will likely rely on a combination of information-driven process control, targeted efficiency retrofits, and progressive substitution of fossil-based electricity with green power.
Earlier national-scale work by Lopes et al. [13] on Portuguese printing and writing paper from Eucalyptus pulp provides additional insight into the division of contributions along the life cycle. For 1 t of 80 gsm office paper, eucalyptus kraft pulping is found to be the main consumer of energy but relies predominantly on biogenic fuels, similar to the pattern observed for the U.S. pulp and paper industry in Tomberlin et al. [19]. By contrast, the paper production stage—where steam and electricity are generated on site—accounts for most non-renewable energy use and the bulk of fossil CO2 and SO2 emissions when heavy fuel oil is used. Transport is the main source of NOx and thus contributes substantially to acidification and eutrophication, while end-of-life management of waste paper, especially landfilling, dominates methane emissions and strongly influences global warming and photochemical oxidant formation. Replacing heavy fuel oil with natural gas in a high-efficiency cogeneration configuration significantly reduces GWP, acidification, eutrophication, and non-renewable resource depletion, underscoring the central role of energy systems in mill-level performance.
Taken together, these case studies show that, across different regions and product portfolios, pulp production and papermaking consistently emerge as the main hotspots in terms of climate change and several other impact categories, driven largely by energy use in digesting, chemical recovery, and drying. At the same time, product characteristics (such as grammage and pulp type), the extent of biomass-based cogeneration, and end-of-life management of paper products can substantially shift the overall balance, in some cases leading to net environmental benefits when avoided burdens from exported electricity and recycling are taken into account. These insights from mill- and sector-level assessments provide the empirical backdrop for the next section, which focuses more specifically on how alternative energy-supply configurations and energy-efficiency measures affect the environmental performance of recycled and virgin paper production.
3.2 Energy supply and mill-level decarbonization options
The case studies discussed above already indicate that fuels and electricity dominate fossil GHG emissions in pulp and paper systems, with process chemicals playing a comparatively minor role. To further unpack this dominance and set the stage for mitigation options, this subsection first draws on process-level energy statistics for Canadian mills and then reviews LCAs that examine how specific choices of energy supply and energy-efficiency measures affect mill-level performance and decarbonization pathways.
These process-level statistics are provided by Owttrim et al. [17], who report final energy consumption per ton of product for major subsectors (chemical and mechanical market pulps, printing and writing paper, newsprint, paperboard) and unit operations, disaggregated by fuel type (electricity, natural gas, biomass, other fossil fuels) (Fig. 2). Electricity is mainly used for mechanical drives and paper-machine operation, while natural gas is primarily consumed in boilers for steam and thermal processes. Biomass represents the use of black liquor and other process residues in recovery and power boilers, and other fossil fuel cover minor supplemental fuels.

Fig. 2.
Final energy consumption of major pulp and paper product systems in Canada, by process stage and fuel type (data from [17]). Values represent final energy use per ton of product.
Process-level patterns reinforce the conclusions from Section 3.1: chemical and mechanical pulping are particularly energy-intensive stages, although the fuel mix differs. In chemical pulping, digestion and the recovery cycle show high use of biomass and electricity, reflecting the heat demand for lignin removal and chemical recovery, whereas in mechanical pulping, refining is dominated by electricity use with very limited thermal fuel input. In the papermaking chain, the paper machine is the largest energy hotspot across all product groups, owing to the high power and heat demand of stock preparation, forming, pressing, and especially drying. This process-level view provides a useful context for interpreting the energy-supply choices and decarbonization options analyzed in the LCA case studies that follow.
Ferrara and De Feo [23] analyze a small recycled-packaging paper mill in southern Italy, explicitly designed to compare alternative energy-supply configurations. The mill produces testliner and fluting from source-separated recovered paper; the functional unit is 1 t of recycled paper and the system boundary is gate-to-gate, covering recovered-paper reception, mixing and pulping, papermaking, reel preparation, on-site wastewater treatment, and waste management, as well as upstream provision of chemicals, water, fuels, and electricity. Two scenarios are modelled: (S1) a natural-gas-fired combined heat and power (CHP) unit that provides all process steam and electricity and exports surplus electricity to the Italian grid, and (S2) a natural-gas boiler supplying steam while all electricity is purchased from the national grid mix. Despite higher on-site gas consumption, the CHP configuration consistently outperforms the boiler+grid case across all midpoint categories and for human-health and ecosystem damage at the endpoint level. Roughly 70% of GWP and about 80% of fossil-resource scarcity stem from natural-gas-based heat and power, but the higher efficiency of cogeneration and credits for exported power more than compensate for the additional fuel use in S1. Furthermore, this study shows that the origin of natural gas matters: varying the import mix between Russian and northern European suppliers changes cradle-to-gate GWP by more than 20% in the CHP case and around 8% in the boiler+grid case, because of differences in upstream extraction and transport burdens. Even in a fully recycled mill, therefore, energy supply remains the primary hotspot, and both the efficiency of energy conversion (CHP vs. separate generation) and the upstream characteristics of fuels (import routes and grid mix) materially influence environmental performance.
Where Ferrara and De Feo [23] focus on current energy-supply options, Buitrago-Tello et al. [29] explore a broader portfolio of future decarbonization measures in a large U.S. kraft linerboard mill (≈2,177 t/day). Using an integrated process-simulation–LCA–economic framework, they evaluate high-efficiency recovery boilers and electric boilers for steam generation, graphene-oxide (GO) nanofiltration membranes and mechanical vapor recompression (MVR) for black-liquor pre-concentration, and several paper-machine upgrades (shoe press, advanced felts, condebelt drying). All options except electric boilers reduce life-cycle GHG emissions relative to the baseline (Fig. 3). GO membranes and condebelt drying deliver the largest reductions (≈14–15%) by substantially lowering steam demand in black-liquor evaporation and the drying section, respectively, whereas high-efficiency recovery boilers achieve ≈10% reductions by increasing steam generation from black liquor and displacing natural gas and grid electricity. MVR and incremental paper-machine improvements (nylon-mesh felts, shoe presses) yield more modest reductions (≈5–8%), mainly through steam savings.

Fig. 3.
Hotspot analysis for carbon emissions of different technologies to improve the steam generation/demand in the production of linerboard. Reproduced from Buitrago-Tello et al. [29], Biofuels, Bioproducts and Biorefining (2025), licensed under CC BY-NC-ND.
Economic results, however, show that the most attractive measures are not necessarily those with the largest percentage reductions. Shoe presses, improved felts, and MVR offer 5–8% GHG reductions with negative or low costs of avoided carbon because fuel savings outweigh additional capital and operating costs, while GO membranes, condebelt drying, and high-efficiency recovery boilers combine higher abatement (≈10–15%) with substantially higher upfront investment. Sensitivity analyses indicate that as the U.S. power grid decarbonizes, electrification-oriented measures (MVR, membranes, condebelt, electric boilers) become progressively more favorable, since the penalty associated with increased electricity demand diminishes. Taken together, the results suggest that mill-level decarbonization will likely proceed through portfolios of energy-efficiency and fuel-switching options, with low- or negative-cost measures adopted first and capital-intensive, high-abatement technologies becoming attractive under higher carbon prices or more stringent climate targets.
Overall, the energy-focused LCAs reviewed in this subsection reinforce the conclusion from Section 3.1 that energy systems are the central lever for reducing GHG emissions in pulp and paper production. They further show that performance depends not only on on-site technology choices (CHP vs. boilers, efficiency upgrades, process integration) but also on upstream fuel chains and the pace of power-sector decarbonization, highlighting the need to coordinate mill-level investments with broader energy-system transitions.
3.3 Water-related impacts and energy–water linkages
Although most LCAs of pulp and paper focus on climate change and energy use, water-related impacts are equally important for this water-intensive sector. Ma et al. [15] address this gap by integrating an energy- and carbon-coupled water footprint (WF) approach with LCA for five kraft wood-pulp-based paper grades (specialty paper, art paper, household paper, lightweight coated paper, and tissue). The functional unit is 1 t of air-dried kraft wood pulp (10% moisture), and the system boundary is gate-to-gate, covering wood-chip preparation, pulping, papermaking, wastewater treatment, and a fully integrated black-liquor recovery system for power, steam, and alkali recovery. Direct water use and emissions at the mill are distinguished from indirect contributions along the supply chain (e.g., raw-material and chemical production, electricity and steam generation).
Methodologically, Ma et al. [15] combine conventional blue and grey WF indicators with LCA midpoint categories to capture both water quantity and water quality dimensions. Blue WF (water scarcity) is calculated for consumptive water use, while grey WF is linked to the assimilative capacity required for pollutants, decomposed into aquatic eutrophication, carcinogenic and non-carcinogenic human toxicity, and freshwater ecotoxicity. In addition, fossil depletion and GWP are included to reflect the strong coupling between energy use and water impacts. A key result is that grey WF scores are more than twice as high as blue WF for all five paper types, indicating that water pollution, rather than volumetric scarcity, is the dominant concern in this Chinese context (Fig. 4). Grey WF is driven mainly by aquatic eutrophication and toxicity indicators, with COD and BOD5 from direct effluent playing a major role, while nutrients and metals such as TP, Cr(VI), Ti, Hg, and As from upstream processes constitute important indirect contributors.

Fig. 4.
Energy- and carbon-coupled water footprint (WF) of paper production for different paper grades (adapted from Ma et al. [15]). T1: CEH bleaching; T2: DCF bleaching; D1 and D2: direct processes. White bars: gray WF; orange bars: blue WF; green bars: direct process; dotted fill: T1; horizontally lined fill: T2.).
The study also compares two bleaching technologies—traditional CEH (chlorination–alkali extraction–hypochlorite) and elemental-chlorine-free (ECF)—and shows that ECF consistently outperforms CEH across climate, eutrophication, and human-health-related indicators, as well as in blue and grey WF. ECF pulp reaches or approaches international best-practice levels for energy consumption (≈7,636 MJ/t), freshwater use (≈32.7 m3/t), and wastewater discharge (≈27.4 m3/t), whereas CEH remains closer to the Chinese average. From an energy–water perspective, coal-based power and steam production emerge as key drivers of both fossil depletion and GWP, explaining why Chinese results are generally higher than those reported for European mills despite similar process configurations. This finding echoes the patterns observed in Sections 3.1 and 3.2: decarbonizing the regional energy mix can simultaneously reduce both climate and water-related burdens.
On the improvement side, Ma et al. [15] highlight the importance of optimizing black-liquor recovery systems and wastewater treatment. Integrating alkali and energy recovery substantially lowers the combined energy-carbon WF, and process-simulation scenarios suggest that upgrading the recovery boiler or introducing black-liquor gasification could raise power-generation efficiency from ≈10–15% to about 34.5%, thereby reducing both fossil-based energy demand and associated water-related impacts. Recycling sludge in the recovery boiler instead of landfilling is also shown to be environmentally preferable. At the system level, further reductions in blue and grey WFs require a combination of national-level energy-structure changes (less coal, more hydropower and wind), enhanced wastewater treatment (e.g., deep-well aeration and biofilm filtration), and improved efficiency in chemical and freshwater use. Overall, Ma et al. [15] demonstrate that in kraft-pulp-based paper production, water-quantity and water-quality impacts are tightly linked to energy supply and recovery-boiler performance, reinforcing the need to treat energy and water management as an integrated problem in future LCAs of the pulp and paper sector.
4. Comparative LCA Studies in the Pulp and Paper Sector
4.1 Virgin vs recycled paper and end-of- life scenarios
Comparative LCAs at the product level most commonly contrast virgin-pulp routes with recycled-fiber routes, and different end-of-life (EoL) options for waste paper. Taken together, these studies broadly confirm that increased use of recovered fiber and diversion of paper from landfill tend to reduce life-cycle greenhouse gas (GHG) emissions. At the same time, they show that the magnitude—and in some cases even the direction—of benefits depends strongly on system boundaries, assumptions about constrained biomass, international fiber markets, and the carbon intensity of background energy systems.
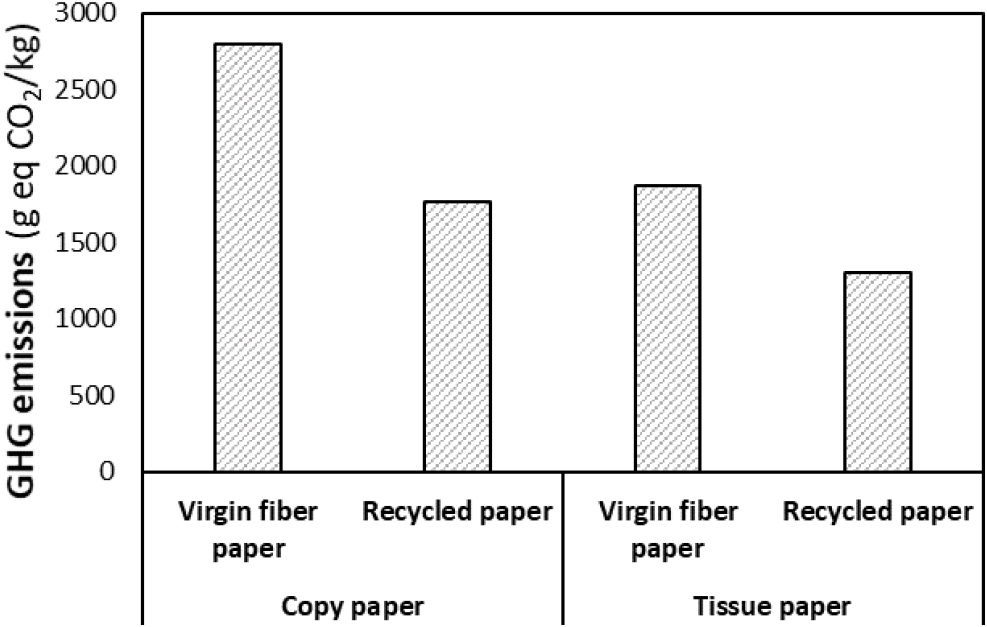
A first group of studies compares similar paper products made from virgin pulp versus recycled waste paper. Drawing on the Environmental Paper Network’s Paper Calculator, Kinsella [34] reports that switching from virgin to 100% recycled copy and tissue papers reduces cradle-to-gate greenhouse gas emissions by roughly one-third, from about 2.8 to 1.8 kg CO2-eq/kg for copy paper (Fig. 5), together with substantial reductions in primary energy use, wastewater and solid waste. At the mill scale, Gemechu et al. [10] provide a detailed comparison for tissue paper produced at a Spanish mill. They find that, when only operations inside the tissue mill are considered, recycling is more energy-intensive: electricity and thermal energy demands are higher in the recycled-waste-paper route due to additional unit operations such as low-density cleaning, deinking, washing, pressing and hot dispersion. However, once a full cradle-to-gate perspective is adopted, total GHG emissions fall from about 1.88 kg CO2-eq per kg of tissue for virgin-pulp tissue to roughly 1.31 kg CO2-eq per kg for recycled-fiber tissue, a reduction of ≈30%. In the virgin system, upstream pulp production and long-distance transport dominate emissions, whereas in the recycled system, on-site electricity and steam use are the main hotspots. Despite lower fiber yield from recovered paper, the case-study mill displaces substantial virgin pulp input, reducing pressure on forests and upstream pulping processes. Together, these studies illustrate how focusing only on on-site energy use can be misleading; full life-cycle accounting is needed to capture the benefits of recycling.
A second strand of work asks how robust the advantage of recycling is to alternative system boundaries and assumptions about biomass constraints. Laurijssen [33] develops two contrasting system definitions to evaluate the impacts of recycling in a context of growing biomass demand. In a “standard” system without explicit resource constraints, where saved wood is not credited outside the paper system, kraft pulps appear to have the lowest net CO2 emissions because large amounts of bioenergy are co-generated from black liquor, even though they have the highest total primary energy input. Recycled pulp has the lowest process energy requirement but relies mainly on fossil fuels and produces little bioenergy, leading to intermediate GHG results. When the system is instead defined under a constrained-biomass assumption, with all unused wood assumed to be converted to bioenergy, the ranking changes markedly: recycled pulp becomes clearly preferable in both energy and CO2 terms, because “saved” wood can now displace fossil fuels elsewhere in the energy system. This comparison underlines that the environmental superiority of recycling cannot be judged from mill emissions alone; it depends critically on whether and how foregone biomass use is accounted for in the broader energy system.
Moving from attributional to consequential perspectives, Chang and co-authors [21] examine what happens when recycled content in U.S. containerboard is increased in a globally traded fiber market. Rather than assuming a fixed 1:1 substitution between virgin and recycled fiber, they use a linear-programming fiber distribution model to determine which grades and sources of recovered paper (additional domestic collection versus reduced exports of old corrugated containers and mixed paper) supply the marginal fiber. These flows are then linked to forest and land-use emissions and a detailed mill-level life-cycle inventory, allowing separate accounting of biogenic and fossil CO2. Scenario analysis shows that, under realistic cost assumptions, most additional recovered fiber comes from diverting exports rather than increasing domestic collection. As a result, higher recycled content in U.S. containerboard reduces U.S. virgin-pulpwood use and landfill methane but induces compensating responses abroad, for example by increasing virgin pulp production or domestic recovery in importing countries such as China. Net GHG savings per unit increase in recycled content are therefore substantially larger when marginal fiber comes from additional recovery that avoids landfilling than when it is sourced by reducing exports. The identity of the marginal grade also matters, because grades differ in export intensity, collection costs, and pulping yields. These findings demonstrate that policies promoting higher recycled content cannot be fully evaluated with simple attributional LCAs or static substitution ratios; explicit representation of market-mediated fiber flows is required.
A complementary set of comparative LCAs focuses on end-of-life pathways for waste paper: landfilling, recycling to new paper products, incineration with energy recovery, and, more recently, biochemical conversion to bioethanol [20]. Arena et al. [20] analyze Italian paper and board packaging waste collected from municipal solid waste and model three options: (a) landfilling in Italy with replacement of recycled board by virgin board produced in Sweden; (b) recycling in Italy with production of recycled board; and (c) incineration with combined heat and power (CHP) in Italy, again substituting Swedish virgin board. Because Swedish board production is powered largely by low-carbon hydro and nuclear electricity, while Italian electricity is dominated by fossil fuels, the ranking of scenarios is strongly influenced by the energy mixes (Fig. 6a and b). In terms of net energy use, incineration with CHP has the lowest total energy consumption per ton of waste, about 41% lower than recycling and 67% lower than landfilling, owing to efficient energy recovery and displacement of fossil-based electricity and heat. For climate change, the recycling scenario exhibits the highest GHG emissions, driven by electricity and steam demand supplied by Italy’s carbon-intensive grid, whereas both landfilling and incineration benefit from substantial avoided burdens associated with Swedish virgin board and, in the incineration case, displaced Italian electricity (Fig. 6c). Landfilling, however, performs worst for acidification and other impact categories due to methane and leachate emissions. The study vividly illustrates how background energy systems and choice of reference products shape the apparent superiority of recycling versus energy recovery.

Fig. 6.
(a) Net energy consumption related to each scenario with the indication of the contribution coming from the different stages. (b) Net energy consumption related to each scenario, reported in terms of primary sources, and (c) Generation of greenhouse gases (expressed as kilograms of CO2 equivalent) related to each scenario with the indication of contributions coming from the different stages. Reprinted with permission from Arena et al. [20]. Copyright © 2004 American Chemical Society.
Wang and co-workers [27] extend the comparison of EoL options by including bioethanol production from different waste paper grades alongside recycling and incineration with varying energy-recovery efficiencies, using both “1 kg of ethanol in a flexible-fuel vehicle” and “treatment of 1 kg of waste paper” as functional units. For some paper types—most notably newspaper converted to ethanol with oxidative-lime pretreatment—the bioethanol route can achieve net GHG emissions comparable to or lower than those of low-efficiency incineration and, in certain configurations, even competitive with recycling when abiotic resource depletion and GWP are prioritized. However, when high-efficiency CHP incineration is available and district heating can be supplied, energy recovery frequently emerges as the best or near-best option in multi-impact terms, especially for office paper and cardboard. For newspaper and magazine, recycling and high-efficiency incineration often have similar profiles, while low-efficiency incineration (electricity only, no useful heat) performs markedly worse. Overall, Wang’s analysis reinforces that there is no universally optimal waste-paper EoL option: the relative performance of recycling, energy recovery, and biochemical conversion depends on local energy systems, available technologies, and the quality and grade of the waste paper.
Taken together, these comparative LCAs converge on several robust insights. From a cradle-to-gate GHG perspective, replacing virgin pulp with recycled fiber generally lowers emissions at the product level, particularly when upstream pulping and long-distance transport are important hotspots. However, the scale of these benefits depends on how biomass constraints, saved wood, and landfill diversion are treated in the system definition, and on how international fiber markets adjust to changes in domestic recovered-paper use. At end of life, diverting paper from landfill is almost always beneficial for climate change, but the trade-offs between recycling, energy recovery, and emerging valorization pathways such as bioethanol production are highly context-dependent and sensitive to energy-system characteristics and technology efficiencies. These findings underscore that fiber-source and EoL choices cannot be evaluated in isolation: they are tightly coupled to energy systems and global fiber markets. In the next subsection, we therefore turn to comparative LCAs that examine how alternative fiber routes and competing materials influence the environmental profile of paper and paper-based products.
4.2 Paper versus alternative materials and fiber routes
Whereas Section 4.1 focused on how recycling and end-of-life options affect impacts within a given paper grade, a second group of comparative LCAs examines how different fiber routes—virgin wood pulps, non-wood fibers and agricultural residues—shape the life-cycle performance of paper products. These studies collectively cover eucalyptus and softwood kraft pulps, recycled fibers, bamboo and other non-wood pulps, as well as straw- and bagasse-based routes, generally on a mass-based functional unit and cradle-to-gate or cradle-to-grave system boundaries.
A mini-review by Favero et al. [8] synthesizes LCAs of paper produced from this wide range of fibers. Across the studies they survey, a consistent pattern emerges once system boundaries and background energy mixes are harmonized: pulping and papermaking processes dominate most impact categories (global warming, acidification, eutrophication, toxicity), whereas the botanical origin of the fiber is usually a secondary driver. For climate change in particular, most fiber options—eucalyptus, softwood, recycled paper, bamboo, wheat straw, bagasse, kenaf and flax—fall within a broadly similar range of GHG emissions per ton of product; differences are largely governed by total energy demand and the share of fossil versus biomass-based fuels in the pulp mill. Hemp is a notable exception, tending to show higher impacts because of intensive agricultural operations (fertilizer use and field work) combined with higher chemical and energy requirements in pulping. In contrast, bagasse can yield very low or even negative net GHG emissions when treated as a co-product of sugar production and combined with low-carbon electricity, highlighting the importance of co-product allocation and energy-system assumptions in comparative assessments.
Sun et al. [31] provide a more detailed review of straw-based fiber routes, focusing on hemp, flax and wheat-straw pulps in Europe and China. Reported GHG emissions range from roughly 4.6 to 14 t CO2-eq per ton of pulp, substantially higher than typical values for wood-based kraft or recycled pulp. In the Spanish hemp/flax case, about 45% of total GHGs originate from agricultural activities—heavy machinery, chemical and fertilizer inputs, and associated N2O emissions—with the remainder largely due to electricity and steam production. In the Portuguese hemp case, absolute GHG emissions are even higher, although the relative contribution of agriculture is smaller. For Chinese wheat-straw pulp, GHG emissions of around 4.6 t CO2-eq per tonne (excluding straw cultivation and harvest) and markedly elevated acidification and eutrophication potentials are driven by low pulping yields, high chemical consumption and energy-intensive straw collection and preparation. Overall, straw-based pulping is characterized by substantially higher GHG, AP and EP scores than wood-based and recycled routes, mainly because of burdens associated with intensive agriculture and less efficient pulping processes.
National-scale results for China further illustrate the spread among non-wood options. Within their consistent life-cycle framework, Man et al. [26] report that straw-based tissue and bagasse-based tissue occupy the upper end of the emission range once plantation carbon sinks are allocated between grain and residue, while wrapping paper based on unbleached chemical bamboo pulp shows the largest relative reduction among virgin-fiber options and becomes the lowest-carbon primary fiber route in their study. This combination of high-impact straw routes and relatively low-impact bamboo underscores that alternative fibers are far from homogeneous: their performance depends as much on agronomic practice, pulping yield and energy supply as on the fact of being non-wood.
Taken together, these comparative studies do not support the idea of a single “environmentally superior” alternative fiber. Instead, they show that life-cycle performance is governed by how fiber cultivation, pulping technology and energy systems interact. Non-wood and residue-based fibers such as bamboo and, in some contexts, bagasse can be competitive with—or better than—conventional wood pulps when coupled with low-impact agriculture and low-carbon energy, whereas straw-based pulps often suffer from high agricultural and processing burdens. Robust comparison of fiber routes in the pulp and paper sector therefore requires careful attention to system boundaries, co-product treatment and background energy mixes, rather than assuming that non-wood or “alternative” fibers are inherently greener.
4.3 Product-level comparisons with paper-based packaging
In contrast to Sections 4.1 and 4.2, which compare generic paper grades and fiber routes, a smaller set of LCAs examines specific packaging products and, in some cases, benchmarks them directly against non-paper alternatives. These product-level studies highlight how design choices in relatively narrow parts of the value chain—such as drying technology or barrier materials—can dominate both environmental and economic performance.
For moulded pulp packaging, Huo et al. [11] analyzed three Chinese production systems using a multidimensional life cycle assessment (MLCA). The functional unit is 1 t of moulded-pulp product ready for dispatch, and the system boundary covers raw-material preparation, forming, drying and finishing. In addition to a conventional LCA, environmental damages are monetised as hidden costs of consumed inputs and combined with direct production costs and value added into a dimensionless sustainability index. The three plants differ mainly in the heat source for drying (coal-fired hot-air furnaces, steam-based drying, and diesel-fired hot-air furnaces). Across all indicators, the drying stage emerges as the dominant hotspot: diesel-based drying leads to the highest direct costs and poor environmental scores, coal-based drying has intermediate costs but the largest hidden environmental cost due to air emissions and ash disposal, whereas steam-based drying achieves both the lowest total cost and the best environmental performance, yielding the highest sustainability index. This comparison reinforces the conclusion from mill-level LCAs that fuel choice and heat-supply configuration are critical levers for improving the performance of paper-based packaging systems.
A second line of work evaluates paper-based beverage cartons against plastic bottles. Schulte et al. [32] model a UHT milk carton based on South-American eucalyptus kraft pulp, converted and used in Europe, and compare it with a PET bottle providing the same packaging service. From a landscape perspective, one beverage carton causes about 66 g CO2-eq per package when substitution effects are excluded, with the climate impact dominated by value-chain emissions from the Uruguayan pulp mill (≈25%), the Swedish packaging board mill (≈44%), and end-of-life combustion of LDPE and PP layers (≈29%), while plantation- and transport-related emissions are minor. Biogenic carbon in standing biomass, harvested-wood products, and soil organic carbon offsets only around 2 g CO2-eq per carton, confirming that short-rotation plantation carbon plays a limited mitigating role at the product level. When both material and energy substitution are included, the balance shifts and the net GWP100 becomes roughly -84 g CO2-eq per carton (Fig. 7), with most of the mitigation driven by displacement of PET bottles and marginal fossil-based electricity and heat. Sensitivity analyses show that this benefit is highly dependent on assumed replacement rates and future marginal energy mixes, whereas biogenic carbon effects remain comparatively small.

Fig. 7.
GWP100 (1 00-year global warming potential) of a beverage cartoon (a) excluding substitution effects, including value chain emissions, end-of-life emissions from incineration, and biogenic carbon fluxes from different sources, and (b) including substitution effects, value chain emissions, and biogenic carbon fluxes. Substitution effects assume moderate PET bottle replacement (R = 0.48, i.e., one beverage carton replaces 0.48 PET bottles). Reproduced from Schulte et al. [32], under the terms of the Creative Commons Attribution License (CC BY 4.0).
5. Conclusion
This review has brought together roughly two decades of LCA studies on pulp and paper systems, spanning mill-level assessments, national inventories and product-level comparisons. Across this diverse literature, a set of robust environmental hotspots emerges: pulping and chemical recovery, on-site energy systems for steam and electricity, fiber sourcing choices (including the balance between virgin, recycled and non-wood fibers), and end-of-life management of paper products. Studies consistently show that energy use in digestion, evaporation and drying dominates fossil GHG emissions and many other midpoint indicators, while process chemicals play a more limited role. At the same time, modern kraft mills exemplify the sector’s dual character as both an energy-intensive industry and a significant producer of renewable process energy via black liquor and biomass firing. Comparative LCAs further indicate that recycling, alternative fibers and paper-based packaging can yield meaningful climate and resource benefits, but that these gains are highly context-dependent—sensitive to energy mixes, waste-management options, fiber-yield assumptions and, in some cases, market-mediated effects in globally traded fiber and energy systems. Taken together, the evidence suggests that there is no single “best” technology or fiber route; instead, effective decarbonization of the pulp and paper sector will require portfolios of measures that combine energy-efficiency improvements, low-carbon heat and power, context-appropriate fiber strategies and robust end-of-life management.
