

1. Introduction
Hygiene paper like bathroom- and facial-tissues, paper towels, napkins, and away-from-home products belongs to the consumer products category having a low density and a low basis weight. Its three most important functional attributes are strength, softness and absorbency. These attributes have generally been evaluated by users subjectively. Home Use Test (HUT), Central Location Test (CLT), Building Panel Test (BPT), and Employee Panel Test (EPT), and Sensory Panel Test (SPT) have been used as subjective test methods.
HUT is conducted by users at home, and is the most expensive method though it best represents the real world. CLT is conducted in a location such as a shopping mall, with a much smaller scale than HUT. BPT is conducted in a building similar with CLT. SPT is conducted in a sensory panel testing laboratory by trained panelists.1)
Either a subject test or a physical test should have a high relevance to the users and small variability. In general, as the relevance to the users increases, so do the variability and the cost for testing as shown in Fig. 1. It shows a trade-off relationship exists generally between the relevance and the variability. As a degree of the constraints increases, the test variability reduces accordingly, resulting in decreasing a degree of the relevance to the real world.
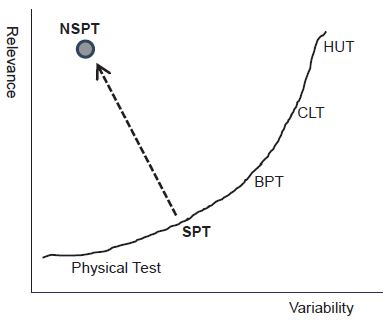
Developing an objective softness test method has been highly desirable due to its some distinctive advantages over the subjective softness test methods. Benefits of objective test methods are cost effective, time effective (i.e., go to market faster) and also easier for quality and statistical process control, guidance and directions to develop and improve products.1-4) In doing so, a a new sensory panel test (NSPT) as shown in Fig. 1 has been desirable.
In a traditional SPT, trained panelists conduct the tests in a controlled test lab. In contrast, in the NSPT, recruited panelists have conducted tests without training. In this study, ranking, rating, and paired-comparison tests have been done for 7 commercial bathroom tissue products.
2. Materials and Methods
2.1 Materials
Seven commercial bathroom tissue rolls from both domestic and imported were used for the NSPT consisted of 100 untrained panelists. The tissue rolls were coded from A to G as not to reveal the product names or the manufacturers.
2.2 Methods
For the NSPT, rating, rank order, and pairedcomparison methods were used for the seven coded bathroom tissue rolls. In rating, the panelists provided their own rating values within a range (from 1 to 99) on the softness of the samples. In rank order, the panelists ranked them on a 1 (least soft)- to-7 (highest) scale for softness the 7 products. In paired-comparison testing, the panelists selected a softer product between two coded samples. Roundrobin paired-comparison tests were performed for the 7 samples, resulting in 21 pairs. The %-preference of each sample was calculated from tallying the preference of each product by the 100 panelists.
For subgrouping round-robin paired-comparison test, the 7 coded samples (A~G) were grouped into two by their rank order:
A round-robin paired-comparison tests were done within each group, resulting in 12 pairs in total. It is noted that each group has a sample that belongs to two adjacent groups. From the roundrobin paired-comparison tests, the Thurstone interval scale values were determined by applying the law of comparative judgment developed by Thurstone.5)
3. Results and Discussion
3.1 Rating and ranking test
Prior to paired-comparison tests, each panelist was asked to rank the 7 coded samples and to rate them from 1 for Poor to 99 for Excellent. Table 1 shows the results of the rating scores and the rank order from the rating scores.
3.2 Paired-comparison test
3.2.1 Full round-robin paired-comparison test
Generating interval scale values from the roundrobin paired-comparison tests have been described elsewhere.1)Table 2 shows the full round-robin test results. In the table, P-matrix is a % of preference of each sample. The table shows the symmetry for each pair whose sum is always 100%. For example, between A and B, the preference for A is 96.0% while that of B is 4.0%. The P-matrix in Table 3 has been converted into the Thurstone interval scale which is the normal deviate (Z-value). 5-7)
Table 2.
Full round-robin test results: P-matrix
| A | B | C | D | E | F | G | |
|---|---|---|---|---|---|---|---|
| A | 4.0 | 21.5 | 25.5 | 55.0 | 27.5 | 43.5 | |
| B | 96.0 | 77.5 | 82.0 | 96.5 | 90.0 | 93.5 | |
| C | 78.5 | 22.5 | 61.5 | 86.0 | 64.5 | 85.5 | |
| D | 74.5 | 18.0 | 38.5 | 85.0 | 63.0 | 71.5 | |
| E | 45.0 | 3.5 | 14.0 | 15.0 | 28.0 | 37.5 | |
| F | 72.5 | 10.0 | 35.5 | 37.0 | 72.0 | 66.0 | |
| G | 56.5 | 6.5 | 14.5 | 28.5 | 62.5 | 34.0 |
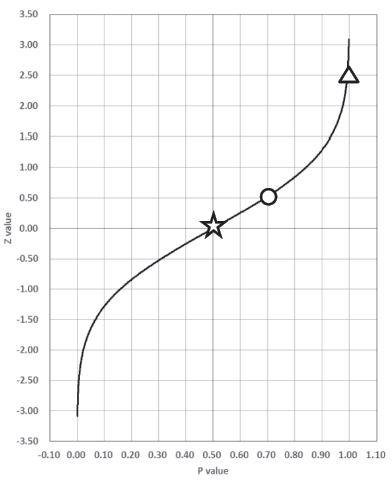
Fig. 2 shows a plot of Z-value against %-preference. It clearly shows that they are not linear. This means that %-preference should not be linear and continuous unlike Z-values. In the Fig. 2, the star indicates the point corresponding to P=0.5 (50%: 50%) and Z=0. The circle indicates the point corresponding to P=0.7 (70%:30%) and Z=0.5. Lastly, the triangle indicates the point corresponding to P=0.98 (98%:2%) and Z=about 2.5. Thus, Z-values increase dramatically with small changes in P-values when P is greater than approximately 0.8.
The Z values of the 7 samples from the full round-robin paired-comparison tests were calculated following the method illustrated elsewhere. 2,5,7)Table 3 shows the results. Compared with Table 2, Table 3 shows that the value is positive when P>0.5, and negative when P<0.5, and zero when P=0.5. It is noted that the sum of any pair is always zero. Since Z-value is linear and continuous, mathematical operations such as addition and subtraction are possible. It is generally more convenient to deal with positive values than negative values. The last row in the table indicates the final Z-values which are not negative.
Table 3.
The Z-values of the 7 samples from the full round-robin paired-comparison
3.2.2 Subgrouping round-robin pairedcomparison test
One problem with the full round-robin test is that when the number of products for test is large, the number of pairs becomes large as well. In a numerical illustration, when N=7 products, 21 pairs are to be tested. When N=10, 45 pairs are to be tested. In addition, Z value increases rapidly at high P of 80% or greater which has been observed in the full round robin tests. To solve these problems with the full round-robin paired-comparison tests, the 7 products were divided into two subgroups.
In the Table 4, F represents the anchor product which appears in both groups. It can be shown that this sub-grouping method reduced the number of required paired comparison tests from 21 for the full round robin tests to 12, resulting in a 40% reduction of tests.
Table 5 shows the Z value comparison between the full round-robin test and the subgrouping test method. It shows that E is the softest and B is the least soft from both paired-comparison tests.
Table 5.
Final Z values: full round-robin paired-comparison test vs. subgrouping round-robin paired-comparison test
| Full | Subgrouping | |
|---|---|---|
| E | 2.14 | 2.52 |
| A | 1.97 | 2.39 |
| G | 1.81 | 2.14 |
| F | 1.38 | 1.64 |
| D | 1.09 | 1.27 |
| C | 0.85 | 1.01 |
| B | 0.00 | 0.00 |
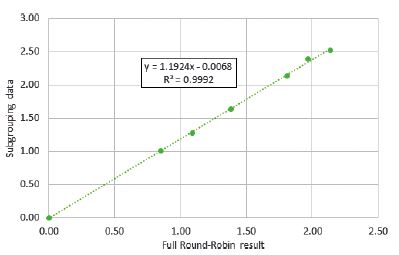
Fig. 3 shows the relationship between the two methods. It shows a great deal of consistency between them. The regression equation in the figure shows that the slope is 1.19 which is greater than one. This indicates that the range of the Z values should be more widely spread out for the subgrouping method than that of the full round-robin test. This means that the subgrouping test method should be more discriminating though it requires a fewer number of pairs than the full robin-tests.
4. Conclusions
For subjective evaluation method of hygienic paper, the new round-robin comparison methods were applied with a newly developed sensory panel test using untrained panelists. The following conclusions were drawn from the NSPT for the seven commercial bathroom tissue products.
A round-robin paired comparison test method can generate the Thurstone Interval scale numbers which are linear and continuous. When more than two products are to be compared, a full roundrobin paired-comparison test is necessary. The number of required paired-comparison tests increases sharply as a number of test products increases. When %-preference (i.e., P values) is high in a paired-comparison test, a small change in the P value could result in a large change in the Z-value which is not very desirable for obtaining reliable and reproducible results. This problem can be solved by subgrouping the products instead of the full round-robin paired-comparison tests. It is important that one product anchors the subgroups.
The NSPT looks promising to generate the interval scale values from round-robin paired-comparison tests. The NSPT should be much easier and simpler than the present SPT while it is more discriminating and more reproducible. The NSPT method is expected to play a critical role in developing an objective softness test method which can be used to predict its subjective evaluation.
