

1. Introduction
The process of papermaking is primarily composed of shaping, squeezing and drying. Among the three sections, the dehydration rate of the drying process only accounts for approximately 1% of the total moisture content of the pulp flowing to the wire. However, the drying process, which has the largest energy consumption in the whole papermaking process, consumes approximately 70% of the energy.1) Therefore, learning more about the paper drying process is of great significance for energy savings and consumption reduction in the paper industry.
Paper is a kind of porous media, and the drying process is essentially a coupled transfer process of heat and mass in porous media. Many scholars have studied the drying process and proposed many different theories. Darcy proposed Darcy’s law, which is applicable to fluid flow in porous media under certain conditions. From this time, studies on the internal mass transfer process of solid materials began using theories such as liquid diffusion theory,2-5) capillary theory,6-9) evaporation and condensation theory,10-12) Luikov theory, Philip and DeVries theory,13,14) Krischer, Berger and Pei theory,15) and Whitaker volume average theory.16) However, the above drying models are based on the continuous medium hypothesis, which is suitable for the whole medium model but no longer applicable when the research scale of porous media is small enough. Therefore, some new theories and methods have emerged, such as pore network models,17) fractal geometry, and multiscale methods. The pore network model method is a complete discretization method that can directly consider the influence of the microstructure of dried material. Nowicki et al.18) studied the drying of porous media by using a pore network on the “characterization volume unit”. Prat (2002)17) studied the micro transmission of drying in rigid porous media and obtained the dynamic drying characteristics of porous media. Multiscale method: With the development of science, multiscale system theory has been pro-posed and developed into a special discipline.19-22) The purpose of this theory is to carry out multi-scale prediction and multiscale control. Fractal theory: Mandelbrot expounded on and developed the idea of fractal geometry in his monograph entitled “Fractals: Form, Chance and Dimension”.23) At present, the main fractal models include the Cantor model, Koch curve, Sierpinsky carpet, irregular fractal pore model, three-dimensional ball stacking model, pore network model, Menger sponge model and so on.
In general, the above models can be summarized as a “continuum model” and “discontinuous model”. In recent years, the lattice Boltzmann method (LBM) has been developed as a new tool to simulate the drying of porous media. The lattice Boltzmann method is based on the fluid micro model and micro dynamic equation,24-26) and its mesoscopic model, which is between the fluid micro molecular dynamics model and macro continuous model, is widely used in drying porous media due to its unique advantages in describing fluid interactions and the superior performance of parallel computing. However, there is no relevant report on the simulation of the paper-drying process by LBM analysis. In view of this, this paper establishes a paper-drying model and uses the LBM method to simulate the moisture migration law in the paper-drying process to provide a reference for the optimization of paper-drying process parameters.
2. Numerical Technique
2.1 Physical model of the paper-drying process
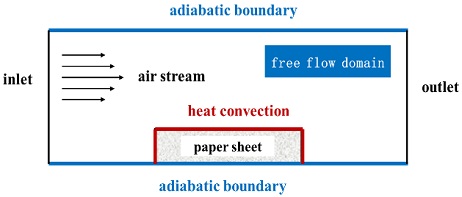
The physical model of paper drying is shown in Fig. 1. The wet paper to be dried is in the free flow field, and the hot air flows over it. The upper, left and right surfaces of the paper are convective heat transfer boundaries, and the lower surface is an adiabatic boundary. The entrance of the free flow domain is the velocity boundary, and the exit is the pressure boundary.
2.2 Equation governing fluid flow in paper
Based on the modified Brinkman Forchheimer extended Darcy model, combined with the mass conservation, momentum conservation and energy conservation equations, the macro control equation for the simulation of the drying heat transfer process of porous media can be obtained as follows:
where u is the average velocity of a fluid, p is the pressure of a fluid, T is the temperature of micro fluids, ε is the porosity of porous media, α is the effective thermal diffusion coefficient, ν is the effective viscosity coefficient, σ is the ratio of a solid skeleton to the heat capacity of a fluid in porous media, and F is the resultant force of a fluid in a solid framework of porous media:
where G=-gβ(T-T0), β is the coefficient of thermal expansion, and T0 is the average temperature. Fε is the geometric factor of porous media, with Fε=1.75(150ε3)-0.5; K is the permeability of porous media, with K=ε3dp2[150(1-ε)2]-1.
The drying problem of porous media described by the above governing equation can be described by four parameters: ε, the Darcy number Da=K/L2, the Prandtl number Pr=ν/αe and the Rayleigh number Ra=gβΔTL3/(ναe).
2.3 Lattice Boltzmann model of the paper-drying rate
In recent years, the lattice Boltzmann method has been successfully used to simulate fluid flow in multiple porous media. Therefore, this paper uses the LBM method to simulate the diffusion rate of vapor in the process of paper drying. Based on the two-dimensional nine speed (D2Q9) model, the evolution equation is as follows:
where fi(x,t) is the distribution function of the discrete velocity ci of the particle at x and time t, τ is the relaxation time, δt is the time step, and is the corresponding equilibrium distribution function and is expressed as follows:
where ωi is the weight coefficient and cs is the speed of sound.
The macro density and macro velocity can be calculated as follows:
The nonequilibrium extrapolation method proposed by Guo Zhaoli et al. is used as the boundary condition.27) It decomposes the distribution function on the boundary node into an equilibrium state and a nonequilibrium state, and the overall accuracy is second-order. In addition, because the numerical stability of the low-order extrapolation scheme is generally better than that of the high-order extrapolation scheme, the nonequilibrium extrapolation scheme also has better numerical stability.
3. Results and Analysis
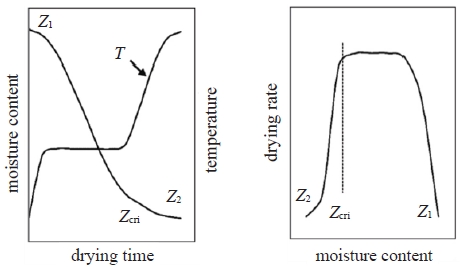
The drying characteristic curve was usually used to describe the whole paper-drying process. The moisture content-drying time curve was called the drying characteristic curve of paper.28) The typical drying characteristic curve of paper was shown in Fig. 2. As shown in Fig. 2, the paper drying process has experienced three stages, namely, pre-heating, constant drying and falling rate drying. At the beginning of drying, the wet paper first enters the preheating stage, and heat was used to heat the paper to increase its temperature, but the moisture content of the paper almost does not change. Then, at the beginning of drying, the vaporization rate of moisture on the surface of the paper was less than or equal to the transfer rate from the inner layer to the surface layer of the paper, and the surface of the paper was still completely wetted by moisture. The drying rate remains constant, and the moisture content of the paper has a linear relationship with the drying time. As the drying process continues, the surface of the paper was only partially wetted, and the transfer rate of moisture from the inside of the paper to the surface was lower than the vaporization rate on the surface of the paper when the moisture content in the paper falls below the critical moisture content. At the same time, the drying rate will continue to fall, and drying is in the falling rate drying stage.
3.1 Model validation
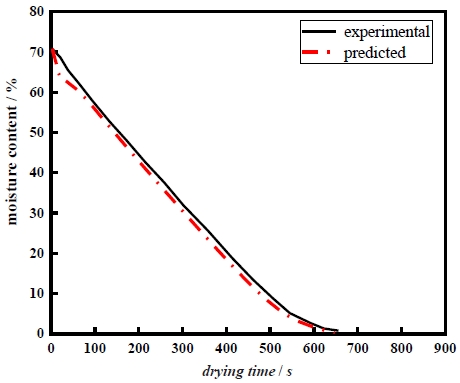
To verify the accuracy of the model, the model calculation results were compared with the experimental results, and the results were shown in Fig. 3. Fig. 3 shows that the calculated results of the model are in good agreement with the experimental results, which indicates that the lattice Boltzmann method is more accurate and reliable in simulating paper drying.
3.2 Effect of paper porosity on drying characteristics
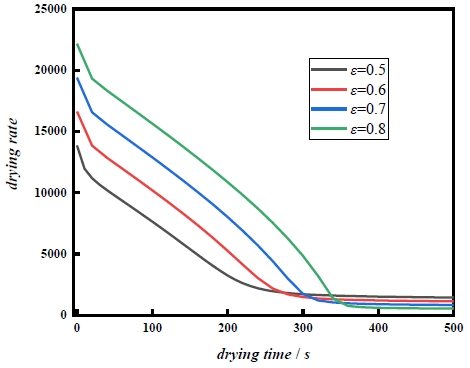
To explore the drying characteristics of different types of paper, the effect of porosity on the drying characteristic curve was studied, and the results were shown in Fig. 4. From Fig. 4, porosity has little effect on drying characteristics in the pre-heating stage. The drying time increases gradually with increasing porosity in the constant drying stage, and the drying rate of the paper with a larger porosity was always higher than that with a smaller porosity. However, the opposite is true in the falling rate drying stage. This may be related to the different forms of moisture in the paper. The moisture can be divided into free water, capillary water, and absorbed water according to the binding force of water in the paper. In the constant drying stage, the main type of water removed was free water, which has little binding with the solid phase and exists in the internal pores of the paper in a free state, and the larger the porosity is, the more free water that was contained in the paper. In the falling rate stage, the main water type removed is capillary water. Capillary water exists between fibers in close proximity to each other and in small capillaries composed of cell cavities, but it is less common in papers with larger porosities.
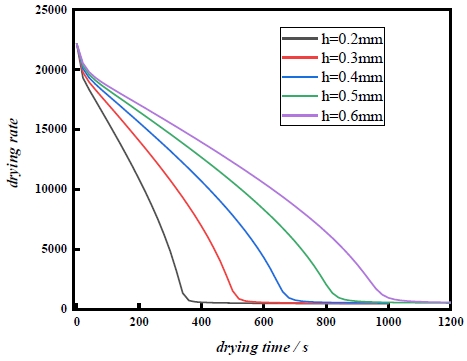
3.3 Effect of paper basis weight on drying
The influence of the paper basis weight on the drying characteristic curve was shown in Fig. 5. The paper basis weight can be directly reflected as the paper thickness: The larger the paper basis weight is, the thicker it is. Fig. 5 shows that with increasing paper basis weight, the paper thickness and the drying time increase gradually. The thicker the paper is, the greater the evaporation resistance of the internal water and the greater the evaporation power needed. At the same time, the heating rate of the paper was reduced, which makes the evaporation rate of the water in the paper decrease and the drying time increase.
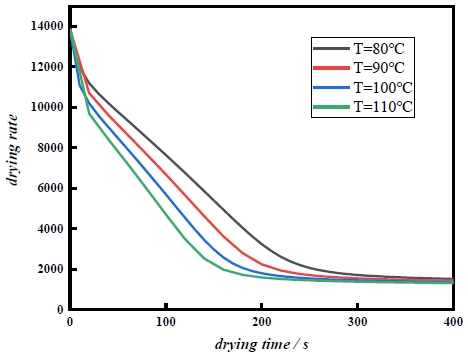
3.4 Effect of drying temperature on drying characteristics
The effect of drying temperature on the drying characteristics is shown in Fig. 6. The figure shows that with increasing drying temperature, the drying time gradually decreases. The drying process was essentially the evaporation of water in the paper. The increase in drying temperature increases the temperature difference between the paper and paper, which enhances the evaporation power and speeds up the evaporation of water to shorten the drying time. When the drying temperature is 80℃, the drying time is 590 seconds; when the temperature rises to 90℃, the drying time is shortened by 25.4%; when the temperature rises to 100℃, the drying time is shortened by 20.5%; and when the temperature rises to 110℃, the drying time is shortened by 18.7%. With increasing drying temperature, the reduction in drying time is limited. Too high a drying temperature may increase energy consumption, so an appropriate drying temperature should be selected for actual production.
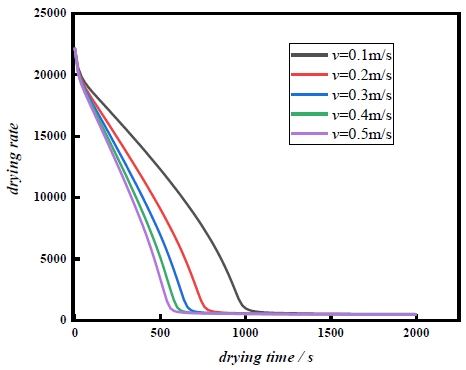
3.5 Effect of hot air velocity on drying characteristics
The effect of hot air velocity on the drying characteristics of paper is shown in Fig. 7. The figure shows that the drying time was shortened with increasing hot air velocity. This is because with the increase in the flow velocity, the Reynolds number gradually increases, and the turbulence of the hot air increases, which enhances heat transfer between the hot air and the paper, increases the evaporation rate of water in the paper and shortens the drying time. The figure also shows that when the hot air velocity is 0.1 m/s and 0.2 m/s, there is a large difference between drying times. When the hot air velocity is higher than 0.3 m/s, the difference between the drying times required by different velocities is increasingly smaller, indicating that the drying efficiency cannot be significantly improved by increasing the hot air velocity.
4. Conclusions
In this paper, the lattice Boltzmann method was used to analyze moisture transfer in the process of paper drying. The effects of porosity, paper basis weight, drying temperature and hot air velocity on the drying characteristic curve of paper were studied. The specific conclusions were as follows:
(1) With increasing porosity, the drying time increases gradually. Free water was mainly removed in the constant drying stage, and the drying rate of the paper with a high porosity increases, while capillary water was mainly removed in the falling rate drying stage.
(2) There was a positive correlation between paper basis weight and thickness. The larger the weight is, the larger the thickness, the greater the evaporation resistance and the longer the drying time.
(3) The drying time was shortened with increasing drying temperature. However, the increase in temperature was limited to shorten the drying time, so the appropriate drying temperature was selected.
(4) The drying time decreases with increasing hot air velocity. When the hot air velocity was higher than 0.3 m/s, the effect on the drying time decreases, and the drying efficiency cannot be significantly improved by increasing the hot air velocity.
