

1. Introduction
The continuous and efficient operation of the papermaking process cannot be separated from the supply of high-quality electricity. The results of the survey on the impact of power quality economics show that the cost of a single damage in production interruption caused by the voltage sag in the papermaking industry is 10,000-30,000 $.1)
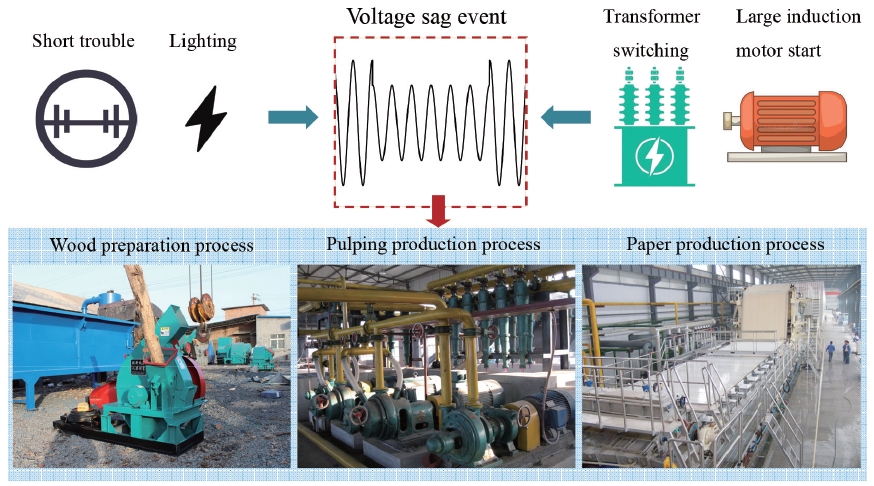
According to the report issued by CIGRE/CIRED/UIE Joint Working Group C4.110, a voltage sag refers to a transient event in which the voltage amplitude in the power grid drops below a threshold and lasts from several cycles to several seconds.2) The causes can be ascribed to short-circuit fault, lightning strike, transformer switching, and high-power induction motor starting.
The extent of injury of the voltage sag event to the papermaking process is determined by the production equipment and sensitive load.3) The papermaking process using wood as a raw material is taken as an example shown in Fig. 1. Wood preparation process is less affected by the voltage sag event, because there is less production equipment and sensitive loads. The production equipment mainly consists of wood chip cutting machines and the sensitive loads mainly include induction motors. When the number of wood chips stored in the chip cutting machine is large, sufficient time for the motor to restart after the trip is provided, and the influence of the sag disturbance is alleviated effectively; paper production process is greatly affected by the voltage sag event, because there is more production equipment and sensitive loads.4,5) The main equipment includes presses, pumps, dryers, calenders and winder, and the sensitive loads mainly include adjustable speed drives (ASD),6) programmable logic controllers (PLC),7) motors,8) etc. When these loads are not working properly due to sag disturbance, the strict synchronization required for the paper production step may be destroyed, which in turn causes the paper to tear. Restarting the interrupted production process is time-consuming and costly. Compared to wood preparation and paper production, pulp production process is moderately affected by the voltage sag event.
For sampling and recording voltage sag events timely and accurately, a three-level monitoring topology is adopted as shown in Fig. 2. This structure can satisfactorily count the frequency of voltage sag events in the external or internal power grid of papermaking enterprise. In Fig. 2, instruments at the first-level monitoring points can be installed on the low-voltage bus side of the 110 kV/10 kV transformer for capturing voltage sag events at the incoming end of the enterprise. Instruments at second-level monitoring points may be installed in a main distribution cabinet in the workshop which is heavily affected by the voltage sag event. Instruments at three-level monitoring points may be installed near the supply inlet side of important production equipment or sensitive loads to achieve capture of the voltage sag event.
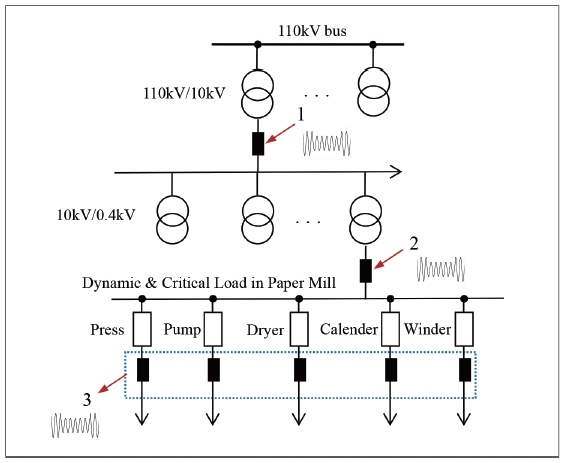
Fig. 2.
Topological structure of power quality monitoring in papermaking enterprises. 1. First-level monitoring points, 2. Second-level monitoring point, 3. Three-level monitoring point.
However, the data sampling method of many commercially available instruments is based on Nyquist theorem. i.e., the ideal sampling frequency should be at least 2 times greater than the highest frequency component in the acquired signals, otherwise, aliasing distortion will occur and the original signal cannot be recovered. Furthermore, to improve the resolution, the actual sampling frequency is often very high. e.g.: For the online movable power quality recorder made by FLUKE, the sampling frequency is 10.24 kHz, and the number of samples per unit sampling period is 200. For G4000 BLACKBOX made by ELSPEC, the number of samples per unit sampling period is even up to 1,024. Thus, the traditional data sampling method will produce a large number of samples and also lead to higher storage costs.
Therefore, a voltage sag data sampling method for papermaking process based on compressed sensing technology is studied and discussed. The test and discussion results show that the method can not only combine sampling and compression, but also greatly reduce the number of samples in the sampling time, with high signal recovery quality, good anti-noise robustness, and strong scalability. It can significantly reduce the redundancy and storage costs in the era of big data.
2. Materials and Methods
2.1 Design of the experimental equipment
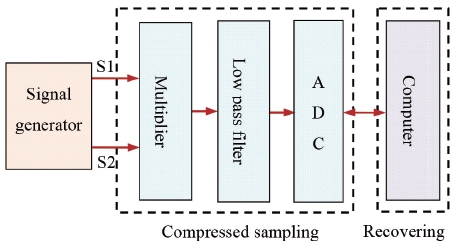
An experimental equipment was designed for verification of the proposed voltage sag data sampling method, which is featured by hardware parameter configurability, signal generation, compressed sampling and signal recovering. To shorten the development cycle, a virtual instrument design scheme is adopted, as shown in Fig. 3. In this figure, signal generator can generate two signals, one for simulating the voltage sag event occurring in the grid, and the other for the pseudo-random sequence. The two signals are collected by an analog-digital converter (ADC) and converted to digital signal after a multiplier and a low-pass filter. The digital signal is then transmitted to a computer via a communication bus for subsequent processing.
The total experimental equipment is shown in Fig. 4, and its core hardware module is described in detail as follows.
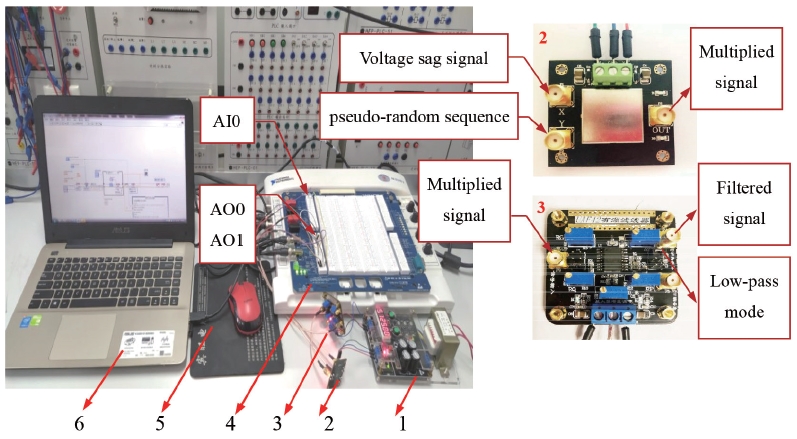
Fig. 4.
The experimental equipment. 1. Power supply (±15 V/±5 V), 2. Multiplier with AD835, 3. Low-pass filter with UAF42, 4. NI ELVIS II development board, 5. USB, 6. PC
(1) Multiplier with AD835. The AD835 is a four-quadrant, voltage output, analog multiplier fabricated on an advanced, dielectrically isolated, complementary bipolar process, and it requires ±5 V power supply. In its basic mode, it provides the linear product of its X and Y voltage inputs. Fig. 4 shows the input and output pin of AD835 module and basic connections for multiplication between the voltage sag signal and pseudo-random sequence.
(2) Low-pass filter with UAF42. The UAF42 is a universal active filter which can be configured for a wide range of low-pass, high-pass, and band-pass filters, and it needs ±15 V power supply. In its low-pass mode, its cut-off frequency and center frequency adjustable range are 0-40 kHz. Fig. 4 shows the input and output pin of UAF42 module and basic connections based on low-pass mode.
(3) NI ELVIS II development board. NI ELVIS II for the hardware lab is a hands-on design and prototyping platform that integrates 12 of the most commonly used instruments. Based on software, this device offers the flexibility of virtual instrumentation and allows for quick and easy generation and acquisition signal. Fig. 4 shows the AO0, AO1 and AI0 channel on the board. AO0 is the output channel of voltage sag signal, AO1 is the output channel of pseudo-random sequence, and AI0 is the input channel for sampling filtered signal.
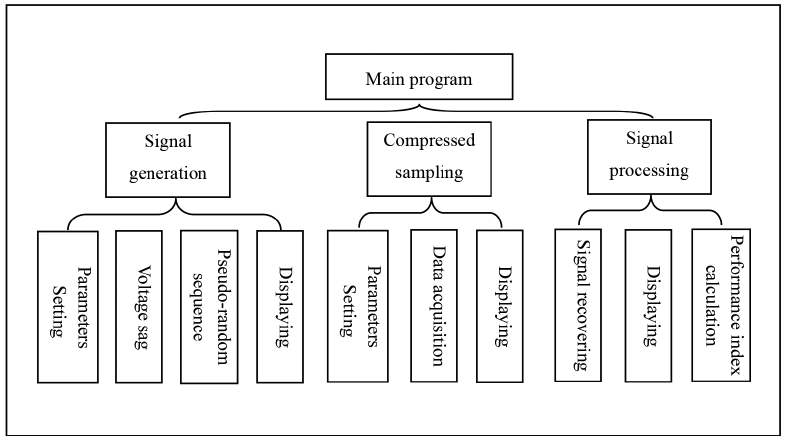
The running software of the experimental equipment is developed on the NI LabVIEW graphical system design platform, which realizes parameter setting and automatic control of hardware module. The software structure shown in Fig. 5 mainly includes signal generation, compressed sampling and signal processing. By setting parameters in these programs, users can control hardware devices for experimental testing. In addition, the MATLAB script function in the signal generation and processing program is used that can realize the seamless docking between LabVIEW and MATLAB software and provide convenience for writing more complicated mathematical programs.
2.2 Performance evaluation indicators and experimental test steps
The indicators for measuring the performance of the proposed voltage sag data sampling method are as follows.
(1) Compressed sampling ratio CSR, whose mathematical expression is
Where, M is the number of compressed samples using the proposed method, and N is the number of samples using the traditional data sampling method. The smaller the indicator, the better the compressed sampling effect.
(2) Unit time compressed sampling ratio UTCSR, whose mathematical expression is
Where, M0 is the number of compressed samples per unit time, and Nmin is the minimum value of samples per unit time recommended by the conventional data sampling method, Nmin=64.2) The index far less than 1, the better the compressed sampling per unit time effect.
(3) Average absolute error MAE, whose mathematical expression is
Where, xoriginal is the original signal and xrecover is the recovered signal. The smaller the indicator, the better the signal recovery effect.
(4) Mean square error MSE, whose mathematical expression is
The smaller the indicator, the better the mathematical model for signal recovery.
The steps for testing the above performance indicators in the developed experimental equipment are as follows.
First, the relevant parameters, mainly including sampling mode, sampling frequency, number of samples and physical channel, are configured before signal generation and compressed sampling module to run. In order to change CSR conveniently, two sampling frequencies and number of samples need to be set. One is a clock frequency fg in the signal generation module, and the number of samples at this frequency is N. The other is the ADC sampling frequency fs in the compressed sampling module, and the number of samples at this frequency is M. When fg is fixed, CSR can be changed by adjusting fs.
Secondly, the signal generation module is operated to generate, display and output the voltage sag signal and pseudo-random sequence, and then the compressed sampling module is operated to acquire and display the respective waveforms after being mixed, low-pass filtered and sampled.
Finally, the signal processing module is operated to display the recovered voltage sag waveform and calculate various performance indices.
2.3 Sampling method of voltage sag data based on compressed sensing technology
Having broken the limitation of Nyquist theorem, compressed sensing technology has been a research hotspot in the field of signal processing.9) In recent years, it has been applied to paper disease data sampling and detection.10,11) The principle of this technology is shown in Fig. 6, and the mathematical description is as follows.
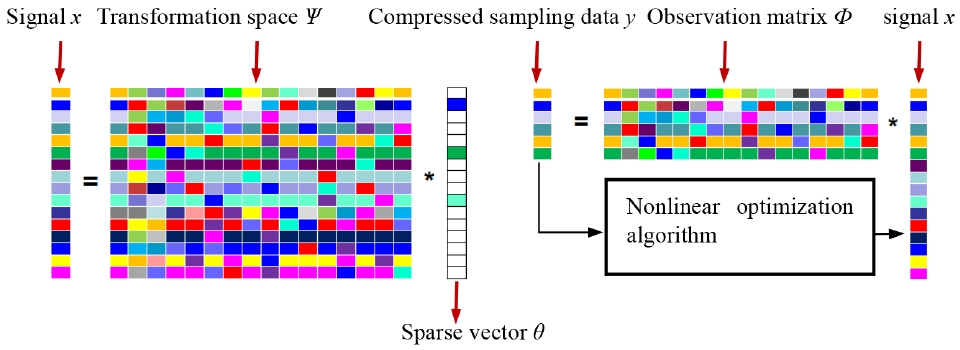
A signal x with length N, whose expression in transformation space Ψ∈RN×N is
Where, θ is a sparse vector, θ=[θ1,θ2,...,θN]∈RN×1. Suppose θ is K sparse, i.e. the number of non-zero coefficients in the vector is K. Then, an observation matrix Ф∈RM×N(K<<M<<N) that satisfies the RIP conditions12) is used to compress x, and compressed sampling data y∈RM×N can be obtained, with the mathematical expression
These “selective” samples contain enough information for recovery signal. However, as shown in Eq. 6, recovering x directly from y is an ill-conditioned equation, and there are infinite solutions. The Eq. 5 is substituted into the Eq. 6, as shown in Eq. 7.
Where, A=ΨФ∈ RM×N is the sensing matrix.
Since θ is K sparse and the number of unknowns is only K, solving Eq. 7 becomes possible. Using nonlinear optimization problem in the 0-norm significance,13) the mathematical model for solving x is as shown in Eq. 8.
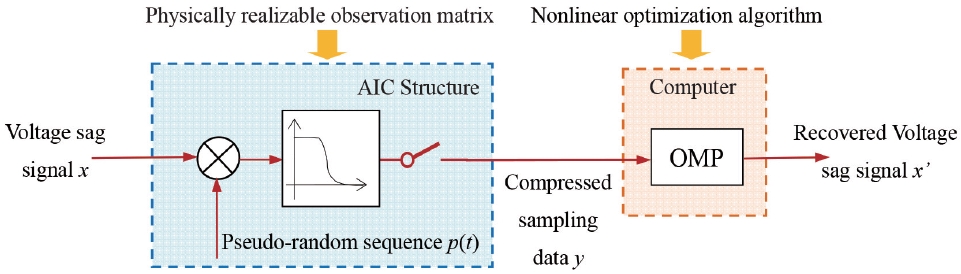
The method of applying the compressed sensing technology to sample voltage sag data is shown in Fig. 7. First, the voltage sag analog signal is sent to a physically achievable observation matrix, and then the digital signal after compressed sampling is output. Second, these “selective” samples are transferred to the computer. Third, a nonlinear optimization algorithm is implemented in the computer to recover signal. Where, the transformation space Ψ selects DFT base (voltage sag signal has better sparsity in DFT space).14) Physically achievable observation matrix Ф selects an analog information converter (RD-AIC), and its structure consists of modulation, low-pass filtering and ADC.15) The nonlinear optimization algorithm selects the orthogonal matching pursuit (OMP) algorithm, which has high reconstruction precision and low computational complexity.16)
3. Results and Discussion
3.1 Results
Due to the different voltage levels at different monitoring points in the papermaking enterprise, for the purpose of testing convenience, the voltage sag amplitude is normalized, and the mathematical expression is
Where, f is the fundamental frequency in the grid, a1 is the depth of the voltage sag (0.1 < a1 < 0.9), t1 is the sag start time, and t2 is the sag end time. The voltage sag signal shown in Eq. 9 is tested, and the output waveforms of each part are shown in Fig. 8.
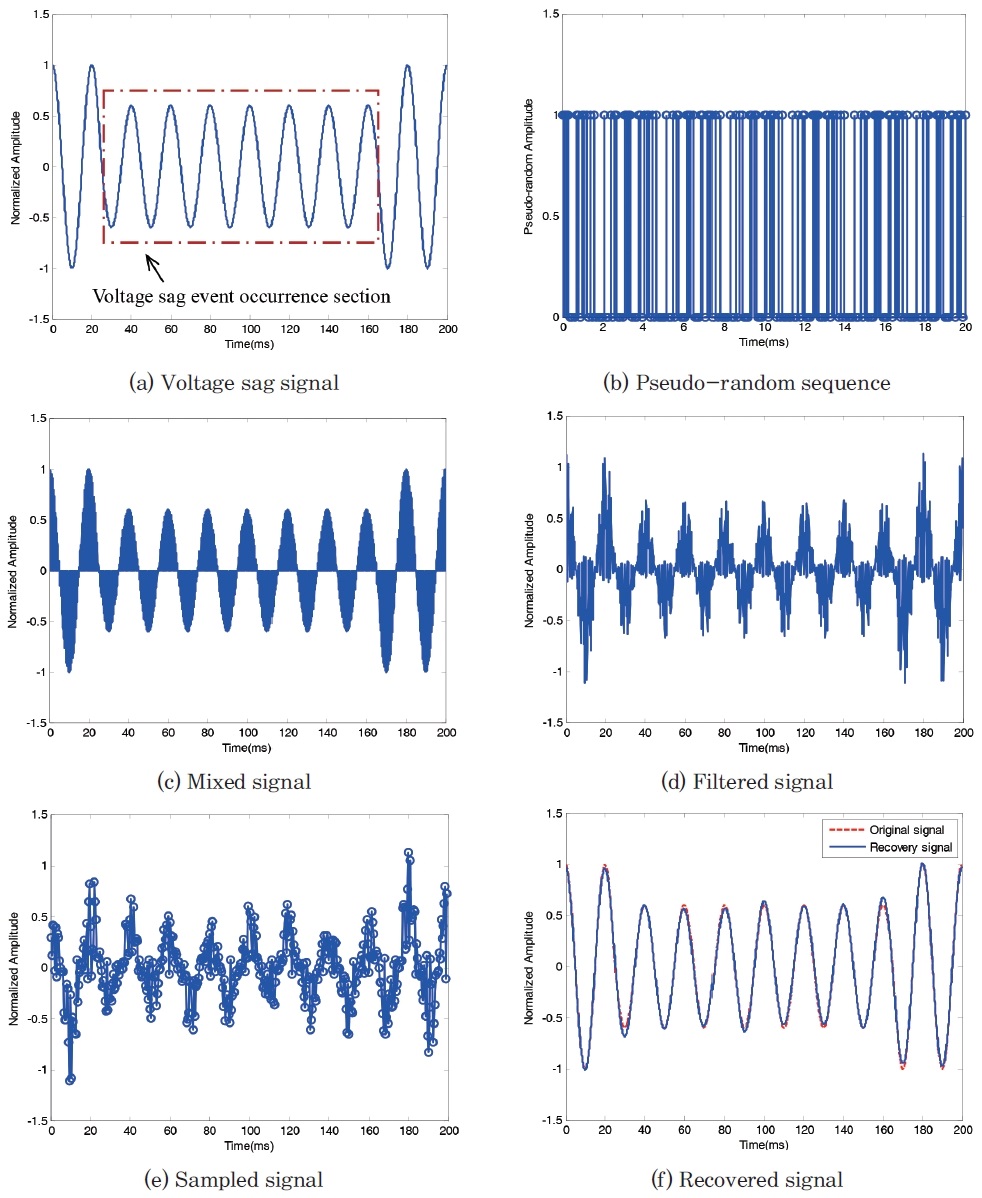
Fig. 8(a-b) shows the voltage sag signal and pseudo-random sequence generated under the set parameters (f=50 Hz, a1=0.4, t1=25 ms, t2=165 ms, fg=10 kHz, N=2,000). Fig. 8(c-e) shows the output waveforms subjected to multiplier, low-pass filter and ADC under the set parameters (fs=0.2 kHz, M=400). Fig. 8(f) is the recovery signal and its comparison with the original signal in the OMP algorithm. After calculation, each performance indicator is CSR=20%, USCSR=0.625, MAE=0.018, MSE=7.67e-4.
Testing is conducted again after adjustment of fs, and the test results are shown in Table 1. When CSR changes from 25% to 1%, UTCSR is less than 1 and shows a significant downward trend. It is indicated that the number of compressed samples per unit time is much smaller. In addition, compared with the traditional sampling method, MAE and MSE are very small and not affect by small samples.
Table 1.
Test results under different sampling compression ratios
According to the above results, the voltage sag data sampling method based on compressed sensing technology is feasible and can accurately recover the original signal with a minimum number of samples.
3.2 Discussion
In terms of the papermaking process, the following aspects should be discussed with respect to whether the voltage sag data sampling method based on compressed sensing technology can be used in practical environment applications.
(1) The randomness. Voltage sag event in power grid of papermaking enterprise is random and its prior information is unknown. In light of this problem, this method should be tested under voltage sag signals of different depth and duration. From Table 2, the recovery effects of different voltage sag signals are better and not affected by CSR, and the smaller the a1, the better the signal recovery effect. These results indicate that the method is applicable to various types of voltage sag events, especially shallow disturbances. In addition, it is recommended that the ADC sampling frequency corresponding to the smallest CSR be taken as the minimum value within the allowable range of recovery accuracy.
Table 2.
Compressed sampling and recovery performance test of various voltage sag signals
(2) Anti-noise robustness. Power signals in power grid generally contain noise, and the distortion degree of power signals can be expressed by signal-to-noise ratio (SNR).17) The larger SNR, the smaller the signal distortion. In light of this problem, this method should be tested under various noises. During the testing, these noises model selected white noise with 15dB SNR, and CSR is set to 2.5%. Fig. 9(a) shows the samples after compressed sampling, and Fig. 9(b) shows the comparison between the recovered signal and the noisy signal. These results show that the nonlinear optimization model adopted by this method can not only reconstruct the signal with high probability under a very small number of samples, but also has anti-noise ability. To further explain the anti-noise robustness of this method, noisy signals with different SNR are tested. From Table 3, both MAE and MSE are affected by noise, but this phenomenon is improved with the increase of CSR. These results show that the method can enhance the anti-noise robustness by slightly adjusting CSR.
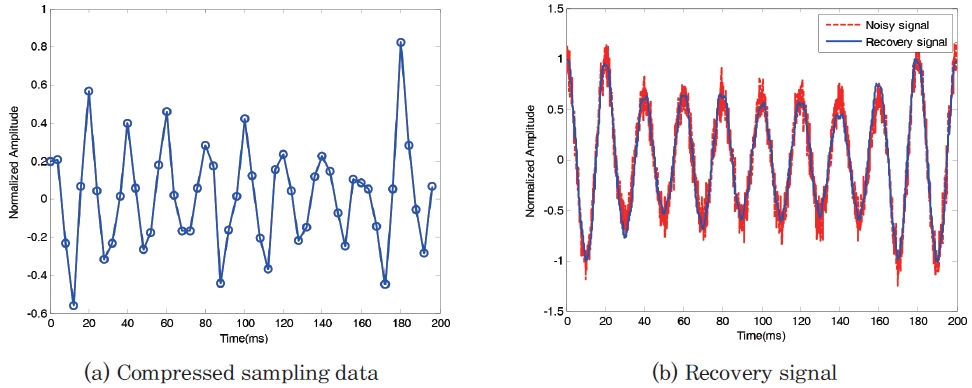
Table 3.
Recovery performance test at different SNR and CSR
(3) Functional scalability. Compared with semiconductor, automobile, steel, chemical and other industries, the paper industry lacks the pursuit of high-quality electric energy, also lacks the statistics and analysis of economic damage indicators of production process and equipment affected by the voltage sag event, and only stays at the stage of attention to the total amount of electricity used by itself. However, with the deepening of the concept of “Paper Industry 4.0” in the world, the papermaking mills are becoming more and more intelligent and having a large number of advanced sensitive loads.18) At present, some enterprises have begun to realize the importance of establishing voltage sag monitoring, analysis and fault diagnosis system. If the method proposed in this paper is used in this system, it can effectively convert the data sampling pressure of the front end into the data processing capability of the computer. That means, by only adding new models and algorithms to the computer, the system can analyze economic impact on the papermaking process and calculate governance costs with a minimum number of samples, and even conduct troubleshooting in combination with other production data.
4. Conclusions
Facing the different voltage sag events in the papermaking process, the data sampling method based on compressed sensing technology can not only complete the data compression synchronously at the sampling front end, greatly reduce the number of samples in sampling time, but also accurately recover the original signal in the computer. Moreover, combined with the actual situation of papermaking, this method is featured by good anti-noise robustness and strong scalability, and the application of this method can effectively help the green development of power operation in paper production process and alleviate the redundant data volume of papermaking mills in the period of big data.
