

1. Introduction
2. Materials and Methods
2.1 Materials
2.2 Lignin extraction
2.3 Spinning dope preparation and electrospinning
2.4 Evaluating the properties of the PAA/lignin dope solution
2.5 Electrospinning characterization
2.6 Statistical comparative analysis
3. Results and Discussion
3.1 Properties of the PAA/lignin dope solutions
3.2 Electrospinnability and fiber morphology
3.4 Statistical significance analysis
4. Conclusions
1. Introduction
Polyimide (PI) is a high-performance polymer with outstanding thermal stability, mechanical strength, chemical resistance, and electrical insulation properties, rendering it widely applicable in advanced industries such as aerospace, microelectronic devices, flexible displays, and separation membranes.1,2,3) PI materials are typically synthesized via the polycondensation of aromatic diamines and aromatic dianhydrides in polar solvents such as N,N-dimethylformamide (DMF) or dimethyl sulfoxide, forming polyamic acid (PAA) as a precursor.4) PAA is readily soluble in polar solvents; therefore, it can be processed into various forms, including films, coatings, and fibers. Notably, electrospinning is a suitable technique for producing PAA-based nanofibers. Electrospinning requires a high-voltage electric field to fabricate micro- to nanoscale fibers from polymer solutions, yielding nanofibrous nonwoven mats with uniform fiber diameters, large specific surface areas, and porous structures.5)
Jirsak et al.6) reported that the electrospinning of PAA solutions based on 4,4′-oxydiphthalic anhydride and 4,4′-oxydianiline with concentrations in the range of 21–26 wt% yielded bead-free nanofibers with uniform diameters in the range of 140–470 nm, depending on the spinning conditions. Moreover, this study reported that the average fiber diameter increased with the increase in PAA concentration. The nanofibers were nearly completely imidized into PI nonwovens by thermal treatment at 230°C for 1 h. The resulting PI nanofiber mats demonstrated excellent thermal stability and potential as polypropylene spunbond-supported composite filter media.
Similarly, Jiang et al.7) successfully fabricated nanofibers with an average diameter of 295 ± 58 nm by electrospinning aqueous PAA solutions as ammonium salts. Subsequently, thermal imidization at 400°C for 1 h yielded PI nanofibers that exhibited excellent performance in high-temperature liquid filtration tests conducted at temperatures over 100°C, indicating the suitability of using these nanofibers in high-performance filtration applications such as engine oil filters. In this context, electrospun PAA nanofibers have demonstrated considerable potential for use in various applications such as membrane separation, adsorption, sensors, and energy storage. These nanofibers can be converted into PI nanofibers, retaining the original fibrous structure while gaining the inherent thermal and chemical stabilities of PI, after thermal treatment. As such, the precise control of the morphology and structural integrity of electrospun PAA nanofibers is a key research area for the development of high-performance PI nanomaterials.8,9,10)
However, conventional petroleum-based PAA synthesis processes often involve the use of substantial quantities of organic solvents and toxic catalysts, raising environmental concerns such as the emission of volatile organic compounds. Furthermore, the intrinsic moisture sensitivity of PAA poses challenges in terms of storage and long-term stability.11,12)
To address these limitations, recent studies have actively explored the development of bio-based polyimide (bio-PI) as alternatives to petroleum-derived polymers.13,14,15) By incorporating bio-based monomers into the PI backbone, the excellent thermal stability, dimensional stability, flexibility, and optical properties of conventional PI can be retained while mitigating the moisture sensitivity associated with PAA.
Lignin, a byproduct of the pulping process, is an aromatic biopolymer containing various polar functional groups such as hydroxyl, methoxy, and carboxyl groups. Lignin has attracted considerable interest as a sustainable alternative to petroleum-based polymers owing to its renewable origin and inherent functionality.16,17) However, the amorphous structure, complex chemical composition, and relatively low molecular weight of lignin limit its ability to form uniform nanofibers when used alone in electrospinning processes.
To address this limitation, this study employed PAA/lignin blended solutions for electrospinning to fabricate environmentally friendly nanofibers. Subsequently, the effects of two key electrospinning parameters, namely, tip-to-collector distance (TCD) and applied voltage, on fiber morphology and diameter distribution were systematically investigated. Next, a two-way analysis of variance (two-way ANOVA) was conducted to evaluate the statistical significance of the parameters, followed by Tukey’s honestly significant difference (HSD) test to determine the differences among individual conditions. Based on these analyses, the optimal electrospinning conditions for obtaining uniform PAA/lignin nanofibers were determined, and foundational insights for the development of bio-based PI materials were obtained.
2. Materials and Methods
2.1 Materials
The PAA used as the electrospinning precursor was synthesized using 3,4,3′,4′-biphenyltetracarboxylic dianhydride and 4,4′-oxydianiline and was supplied by a PI Solution Tech (Daejeon, Republic of Korea). Hardwood kraft black liquor, used for lignin extraction, was provided by Moorim P&P (Ulsan, Republic of Korea). H2SO4 (95.0%) was purchased from Daejung Chemical & Materials (Republic of Korea). To dissolve the PAA/lignin blend, DMF (99.9%, special grade), obtained from SAMCHUN Chemical (Republic of Korea), was used as the solvent.
2.2 Lignin extraction
In order to recover lignin, 95% H2SO4 was added dropwise to 1 L of hardwood kraft black liquor (initial pH = 13) until a pH of 3 was reached. The acidified black liquor was subsequently stirred in a reactor at 70°C for 1 h to precipitate lignin, which was collected via vacuum filtration using filter paper (Advantec, 100 circles, No. 2, 185 mm) and repeatedly washed with deionized water until the pH of the filtrate became neutral. The characteristics of the purified lignin, including acid-insoluble lignin (TAPPI T 222 om-02), acid-soluble lignin (TAPPI UM 250), and ash content (TAPPI T 211), are presented in Table 1.
Table 1.
Chemical properties of lignin used for electrospinning
|
Ash (%) | Total lignin content (%) | ||
| Acid-insoluble lignin | Acid-soluble lignin | ||
| Hardwood kraft lignin | 0.5 | 81.6 | 8.4 |
2.3 Spinning dope preparation and electrospinning
PAA and lignin were each dissolved in DMF with a solid content of 11 wt% inside an N2-filled glove box (LK Lab Korea Co., Ltd., Republic of Korea) to prepare the electrospinning dope. The two solutions were subsequently mixed according to the composition ratios listed in Table 2. To prevent exposure to atmospheric O2, the mixed solution was sealed in a vial under an N2 atmosphere and stirred at 600 rpm for 2 h to obtain a homogeneous PAA/lignin mixture.
Table 2.
Compositions of the electrospinning dope solutions prepared using PAA, lignin, and DMF
| PAA (g) | Lignin (g) | DMF (g) | |
| PAA/lignin | 9.9 | 1.1 | 89 |
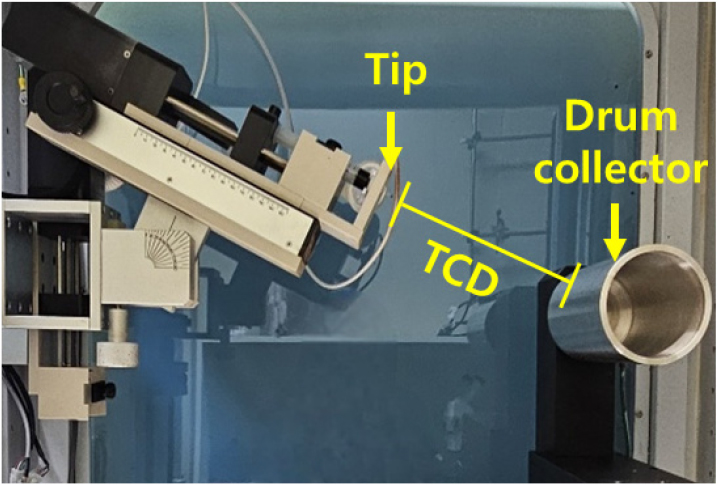
Next, PAA/lignin-based nanofibers were fabricated using the electrospinning setup illustrated in Fig. 1. A drum collector wrapped with release paper collected the fibers, which have TCD values in the range of 15–23 cm. The spinning solution was loaded into a 12 mL syringe equipped with a 23-gauge metal needle and electrospun under controlled environmental conditions (30 ± 2°C, 30 ± 2% relative humidity). The flow rate was fixed at 1 mL/h, and the applied voltage was varied between 14–20 kV.
2.4 Evaluating the properties of the PAA/lignin dope solution
The rheological properties of the PAA/lignin mixed dope solutions were evaluated using a rotational rheometer (Anton-Paar MCR 102e, Austria). A parallel plate (25-mm diameter) geometry was employed, and viscosity (in cP) was measured at a constant shear rate of 10 s-1 at 25°C.
2.5 Electrospinning characterization
The surface morphologies of the nanofiber sheets were observed using a field-emission scanning electron microscope (Hitachi SU8220, Japan) with the accelerating voltage set at 5.0 kV. Each sample was imaged at magnifications of 1,500× and 5,000×, and the acquired scanning electron microscope (SEM) images were analyzed using the ImageJ software (National Institutes of Health, USA). The average diameter and standard deviation (SD) of the nanofibers were calculated based on 100 measurements obtained from five representative SEM images. For each image, 20 individual fiber diameters were randomly selected and measured. The uniformity of fiber diameter was evaluated using Eq. [1], as described in a previous study.18)
: coefficient of variation
: standard deviation (±SD)
: average diameter of each fiber
2.6 Statistical comparative analysis
Two-way ANOVA was conducted to evaluate the individual and interactive effects of TCD and the applied voltage on the average fiber diameters calculated from the measured fiber diameters from the SEM images. For this analysis, voltage levels (14, 16, and 18 kV) and TCD values (15, 18, 20, and 23 cm) were set as independent variables, whereas the average fiber diameter was set as the dependent variable. The level of statistical significance (α) was set at <0.05. When significant differences were detected in the ANOVA results, Tukey’s HSD post-hoc test was conducted to further compare mean fiber diameters across various conditions. All statistical analyses were conducted using the built-in statistical tools in OriginPro® (OriginLab Corporation, USA).
3. Results and Discussion
3.1 Properties of the PAA/lignin dope solutions
Lignin is generally unsuitable for stable electrospinning when used alone owing to its low molecular weight and complex, non-linear chemical structure.19) To overcome this limitation, PAA was employed as a polymeric matrix to blend with lignin, and the spinnability of the resulting solution was assessed based on viscosity. All dope solutions are prepared at a fixed solid content of 11 wt%, and the measured viscosities are listed in Table 3.
Table 3.
Comparison of the viscosities of the PAA, lignin, and PAA/lignin blend solutions at 11 wt% solid content
| Viscosity (cP) | Note | |
| PAA | 35,894.8 ± 32.4 | Solid content: 11 wt% |
| Lignin | 15.5 ± 5.5 | |
| PAA/lignin (9:1 w/w) | 17,944.4 ± 90.2 |
The neat PAA solution exhibited a high viscosity of 35,894.8 ± 32.4 cP, whereas the viscosity of the lignin-only solution was significantly reduced, i.e., 15.5 cP, indicating unsuitability for electrospinning. In contrast, the PAA/lignin blend (9:1 w/w) exhibited a reduced viscosity of 17,944.4 cP, approximately 50% lower than that of the pure PAA solution. This reduction can be attributed to the inherently low molecular weight and dispersibility of lignin, which possibly disrupts the intermolecular interactions among PAA chains, thereby decreasing the overall solution viscosity.
Despite this, the PAA/lignin mixture maintained a viscosity of over 10,000 cP, which is considered sufficient for electrospinning. These findings suggest that PAA serves as an effective polymer matrix, enabling the formation of electrospinnable solutions even once lignin is incorporated.
3.2 Electrospinnability and fiber morphology
During the electrospinning process, the Taylor cone refers to the cone-shaped droplet of the polymer solution that is formed at the nozzle tip under an electric field. From this cone, a charged solution is ejected as a fine, continuous jet, which elongates toward the collector.20) The formation of a stable cone jet is a critical factor that directly affects the fiber diameter and uniformity, with key influencing parameters including the TCD and applied voltage.21)
Fig. 2a displays the jet behaviors observed under varying voltages (14–20 kV) and TCDs (15–23 cm) categorized into three types: ○ represents stable single jets, △ represents unstable cone jets, and × represents multiple jets. Representative jet morphologies corresponding to each type are shown in Fig. 2b. The analysis revealed that stable single jets were predominantly observed when the TCD was between 15–20 cm and the applied voltage was between 14–16 kV. This suggests an optimal balance between solution viscosity and electric field strength, facilitating the stable ejection of jets.
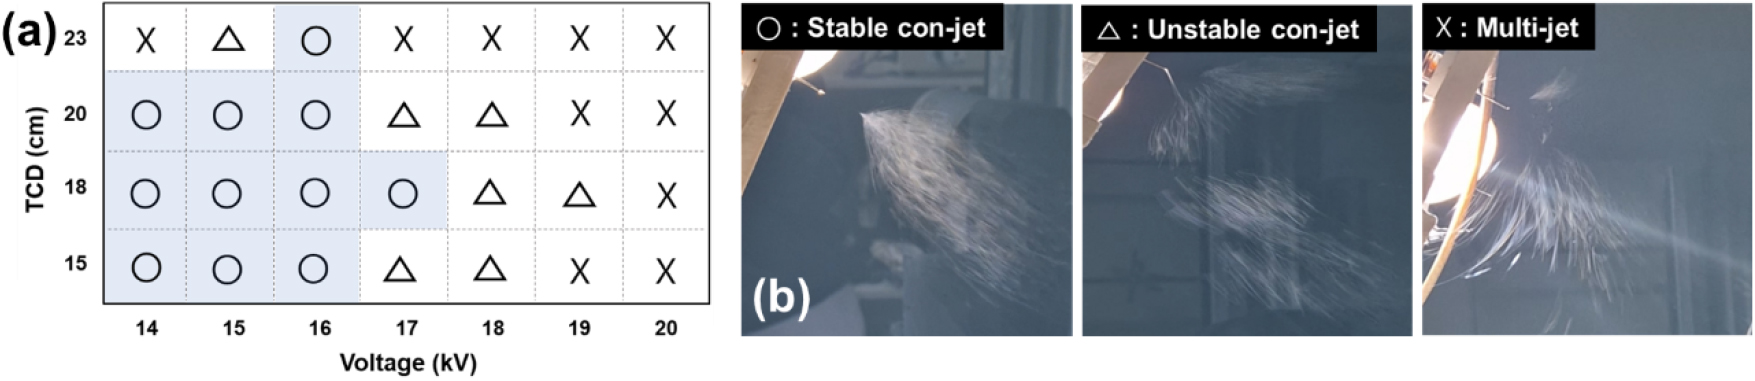
Conversely, when the TCD was increased to 23 cm, no stable jet was formed, regardless of the applied voltage. This can be attributed to the large distance, weakening the electric field strength and charge accumulation on the jet surface, both of which can induce multiple jet formations.22,23) Additionally, under high-voltage conditions (≥18 kV), the frequency of unstable or multiple jets increased regardless of the TCD. Although high voltage is generally beneficial for initiating the Taylor cone and jet formation, exceeding the critical threshold can generate excessive electrostatic stretching forces and charge buildup on the jet surface, thus causing electrostatic repulsion and unstable spray-like ejection.23)
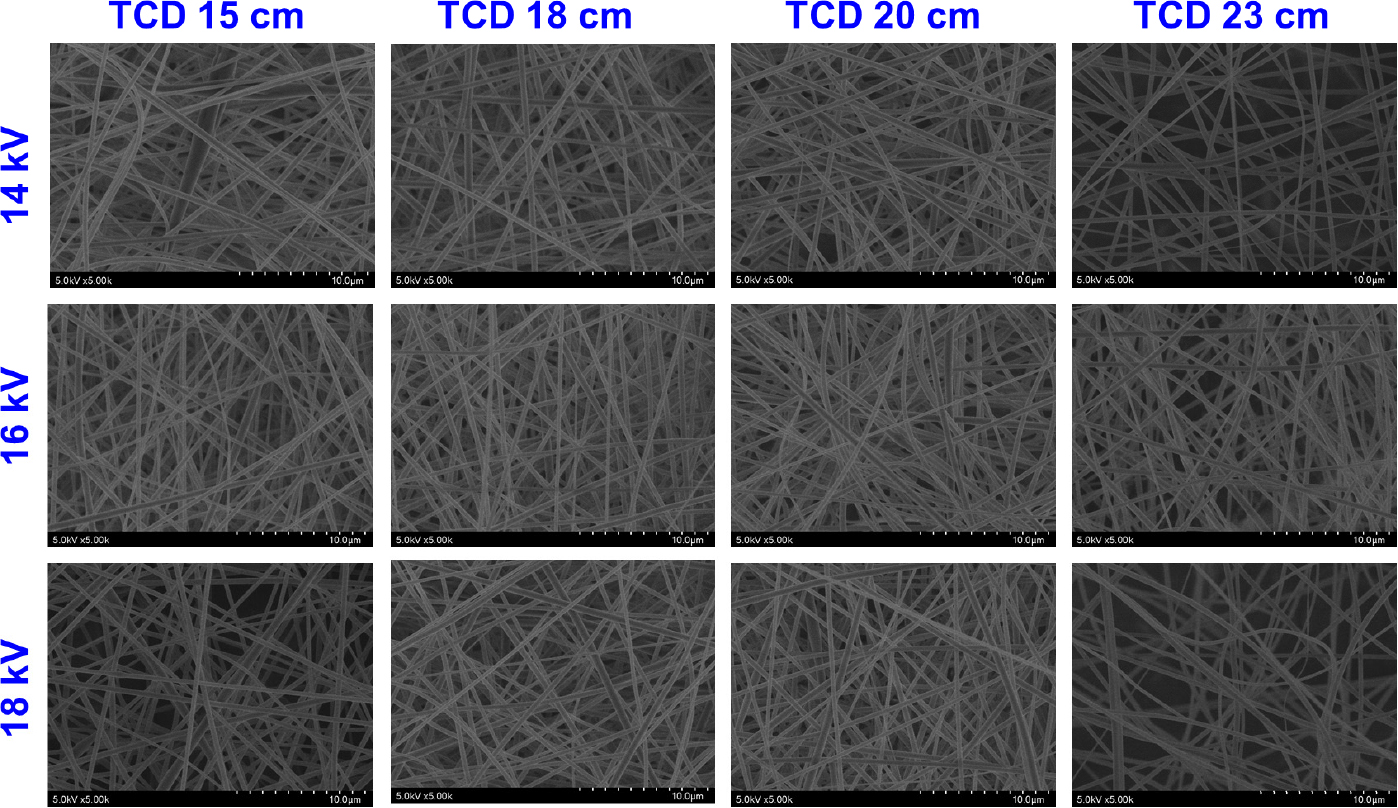
The obtained SEM images were analyzed (Fig. 3), and the measured fiber diameter distributions were visualized as histograms (Fig. 4) to compare the surface morphologies and diameter distributions of the PAA/lignin composite nanofibers fabricated under various electrospinning conditions. Under all conditions, continuous fibers free of bead defects were observed, indicating that the viscosity of the PAA/lignin blend solution was suitable for uniform nanofiber formation within the voltage range of 14–18 kV and the TCD range of 15–23 cm.
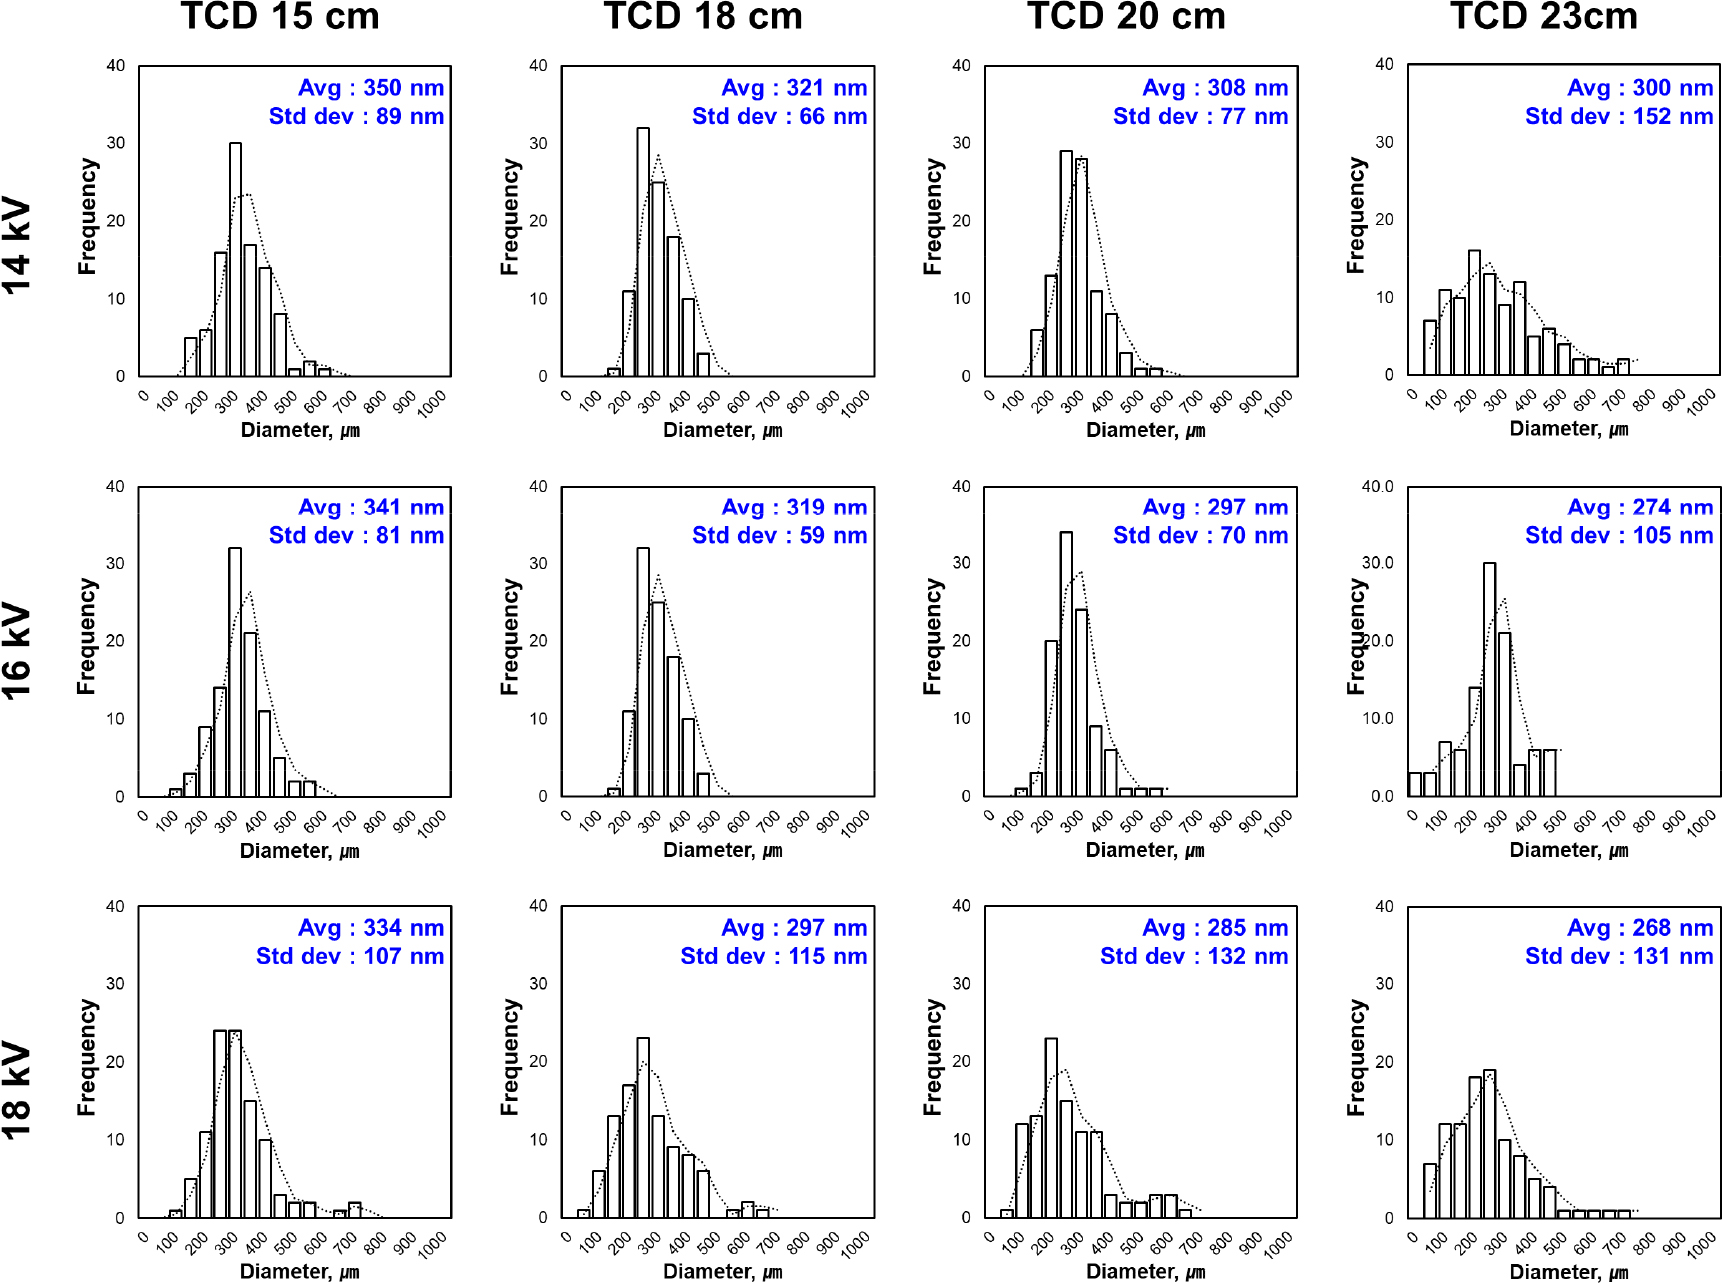
Histogram analysis revealed a general trend of decreasing average fiber diameters with increasing voltage and TCD. Under a TCD of 15 cm, the average fiber diameters decreased from 350 nm (14 kV) to 341 nm (16 kV) and 334 nm (18 kV). Similarly, at TCDs of 18 and 20 cm, a voltage increases from 14 to 16 kV reduced fiber diameters by approximately 7.5%. At a TCD of 23 cm, the average fiber diameter gradually decreased from 300 nm (14 kV) to 274 nm (16 kV) and 268 nm (18 kV), with transition from 14 to 16 kV yielding a 10.7% reduction in fiber diameters. This trend can be attributed to the tensile force acting on the jet increasing with the increase in electric field strength, promoting fiber elongation.21,23) Additionally, at a constant voltage, an increasing TCD increased the flight time of the jet and solvent evaporation, further reducing fiber diameters.
When the TCD was too short, insufficient solvent evaporation may have hindered complete fiber solidification, increasing fiber diameters and decreasing uniformity. In contrast, a long TCD can compromise electric field stability, inducing unstable jet behavior that reduces fiber diameter and uniformity. Overall, a 16-kV voltage and an 18-cm TCD conditions yielded the most uniform fibers, with an average diameter of 319 nm and an SD of 59 nm. Therefore, this condition can be considered optimal for electrospinning PAA/lignin solutions to yield uniform nanofibers.
Fig. 5 presents the coefficient of variations (CVs) of the diameters of the PAA/lignin-based nanofibers fabricated under various electrospinning conditions. The CV, defined as the ratio of the SD to the mean, quantitatively evaluates the relative uniformity of fiber diameters, with low values indicating narrow diameter distributions with high uniformity.24) The results reveal that the highest uniformity in fiber diameters was achieved under a moderate voltage (16 kV) and relatively short TCD. In particular, a TCD of 18 cm and a voltage of 16 kV yielded the lowest CV of approximately 18.4%, indicating that a stable cone-jet formation and an appropriate electric field strength facilitated uniform jet elongation. Conversely, as TCD increased to 23 cm and voltage ranged between 14–18 kV, the CV markedly increased and reached between 48–50%, indicating a highly heterogeneous distribution of fiber diameters. Furthermore, under identical TCD conditions, the CV tends to increase in the order of 16 kV < 14 kV < 18 kV, consistent with the jet stability results displayed in Fig. 2.
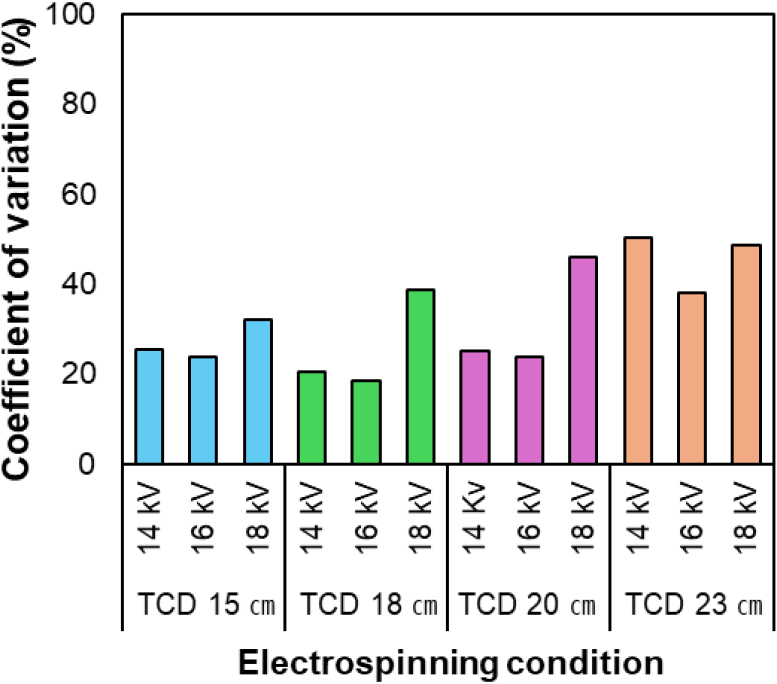
These findings highlight the importance of optimizing the TCD and voltage combination to ensure uniform nanofiber formation.
3.4 Statistical significance analysis
A two-way ANOVA was conducted to evaluate the main and interaction effects of electrospinning process parameters, i.e., TCD and applied voltage, on the diameters of the PAA/lignin-based nanofibers. The degrees of freedom, sum of squares, mean square, F-value, and p-value of each factor are listed in Table 4. The F-value of TCD was 19.08 with a corresponding p-value of 4.35 × 10⁻¹², indicating that TCD had a highly significant influence on fiber diameter (p < 0.05). Likewise, the applied voltage exhibited a statistically significant effect, with an F-value of 5.42 and a p-value of 0.00456, demonstrating the important role of applied voltage in controlling fiber morphology. In contrast, the interaction effect between TCD and voltage yielded a p-value of 0.93071, which was statistically insignificant, implying that the combined effect of these two variables was insubstantial.25) More specifically, although both parameters independently influenced fiber diameter, their synergistic or interfering interaction was not meaningful. Additionally, the overall model exhibited a highly significant p-value of 2.66 × 10⁻¹⁰, confirming the robustness of the statistical model and supporting the conclusion that fiber diameter can be effectively regulated by precisely controlling TCD and applied voltage.
Table 4.
Two-way ANOVA results showing the effects of TCD, applied voltage, and the interaction of the two parameters on fiber diameter
Tables 5 and 6 summarize the effects of TCD and applied voltage, respectively, on the mean diameters, SDs, and variances of the electrospun fibers. Table 5 reveals that the mean fiber diameters corresponding to different TCDs were measured as 341.56 nm (15 cm), 312.57 nm (18 cm), 296.55 nm (20 cm), and 280.58 nm (23 cm), exhibiting a clear decreasing trend in diameters with increasing TCD values. However, unlike the mean values, the SDs and variances of the fiber diameters were lowest at 18 cm, whereas a sharp increase in variability was observed at 23 cm. In particular, at 23 cm, the variance exceeded 10,000 nm2, indicating a significant deterioration in fiber uniformity. This suggests that a large spinning distance can reduce fiber homogeneity.
Table 5.
Mean fiber diameters, SDs, and variances of the electrospun PAA/lignin nanofibers according to TCD
| TCD (cm) | Number of samples | Fiber diameter (nm) | Variance (nm2) | |
| Mean | SD | |||
| 15 | 300 | 341.56 | 93.65 | 8,770.87 |
| 18 | 300 | 312.57 | 84.75 | 7,183.19 |
| 20 | 300 | 296.55 | 97.55 | 9,516.23 |
| 23 | 300 | 280.58 | 131.34 | 17,250.67 |
Table 6.
Mean fiber diameters, SDs, and variances of the electrospun PAA/lignin nanofibers according to applied voltage
| Voltage (kV) | Number of samples | Fiber diameter (nm) | Variance (nm2) | |
| Mean | SD | |||
| 14 | 400 | 319.87 | 103.48 | 10,709.03 |
| 16 | 400 | 307.72 | 84.36 | 7,116.75 |
| 18 | 400 | 295.86 | 124.20 | 15,425.57 |
Table 6 reveals that the average fiber diameters decreased progressively from 319.87 nm (14 kV) to 307.72 nm (16 kV) and 298.18 nm (18 kV) with increasing voltage, indicating an increase in jet stretching under high electric fields. However, at 18 kV, a variance of 15,425.57 nm2 was obtained, revealing that diameter uniformity was compromised, although high voltages yielded thin fibers. In contrast, the 16-kV condition exhibited a relatively low variance (7,116.75 nm2) and a moderate mean diameter (307.72 nm), indicating the optimal balance between electrostatic stretching and fiber uniformity.
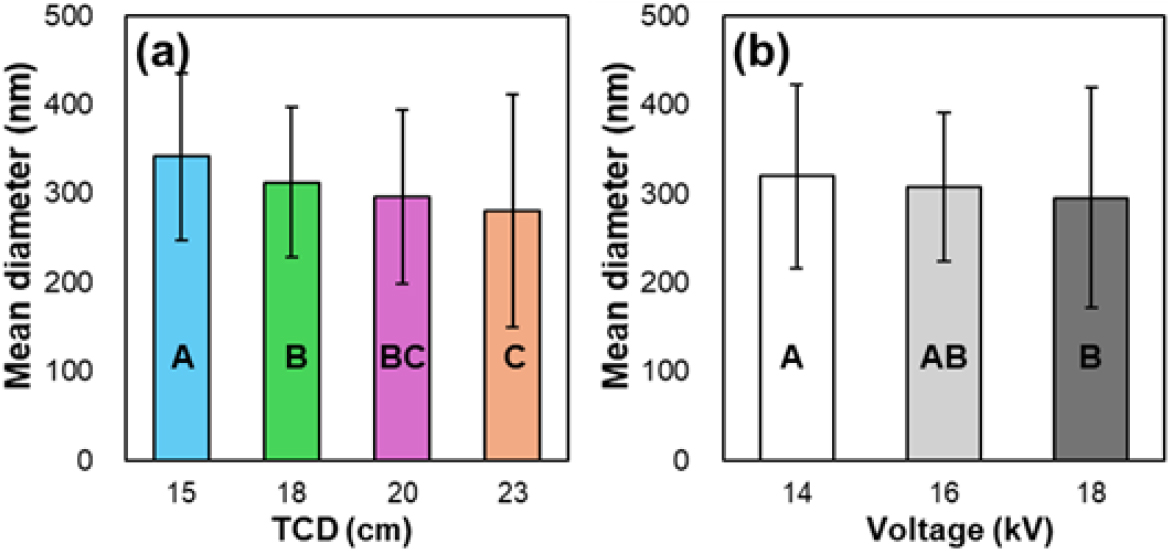
Post-hoc comparisons are conducted using Tukey’s HSD test to further examine the differences between the group means identified as statistically significant according to the ANOVA results, and the outcomes are displayed in Fig. 6. The alphabetical groupings (A–C) annotated above the bar graphs indicate statistically significant differences at the p < 0.05 level. The differences in mean fiber diameters between conditions were considered significant when groups did not share the same letter. In the case of TCD (Fig. 6a), the condition yielding the largest mean diameter, 15 cm (341.6 nm), was classified as Group A. The 18-cm condition (312.6 nm) was classified into Group B, whereas the condition yielding the highest average diameter at 23 cm (280.6 nm) was assigned to Group C, indicating statistically significant differences. In contrast, the 20-cm TCD condition belonged to an overlapping category (Group BC), suggesting that the difference in means was unclear in this case. In the case of applied voltage (Fig. 6b), the groupings revealed significant distinctions as follows: 14 kV was categorized as Group A (319.9 nm), 16 kV as Group AB (307.7 nm), and 18 kV as Group B (295.9 nm). The results revealed that the 14- and 18-kV conditions were statistically distinct, whereas the 16-kV condition, classified as the intermediate Group AB, represents a transitional range between the two. Overall, these statistical analyses confirmed that electrospinning parameters, particularly TCD and applied voltage, are key factors influencing fiber diameter. Notably, the 18-cm TCD and 16-kV voltage combination yielded the most favorable results, i.e., a small average diameter and the lowest CV, indicating superior uniformity and process stability. Based on these findings, further investigations are warranted to evaluate the mechanical, thermal, and microstructural properties of bio-PI fibers produced under these optimized conditions, with an emphasis on the potential functional applications of these fibers.
4. Conclusions
In this study, the effects of TCD and applied voltage on the morphologies and diameter uniformities of electrospun PAA/lignin nanofibers were investigated. The viscosity of the PAA/lignin solution was suitable for electrospinning (viscosity of 17,944 cP), and all fibers fabricated under various conditions showed bead-free, continuous morphologies. Jet stability analysis revealed that a stable cone jet was achieved at TCDs between 18–20 cm and an applied voltage of 16 kV. The average fiber diameter decreased with increasing TCD and voltage. Notably, the 18-cm TCD and 16-kV applied voltage condition yielded the most uniform nanofibers with an average diameter of 319 ± 59 nm and a CV of 18.4%. Two-way ANOVA demonstrated that both TCD and voltage had statistically significant effects on fiber diameter (p < 0.05), whereas the interaction between the parameters was statistically insignificant. This indicates that each parameter can be independently optimized to control fiber characteristics. Overall, the 18-cm TCD and 16-kV voltage combination was identified as optimal for producing uniform PAA/lignin nanofibers. This study confirmed the electrospinnability of biomass-derived lignin and yielded fundamental insights into the process optimization and broad application potential of eco-friendly polymeric nanofibers. These findings can form a valuable foundation for the future development and application of bio-PI materials.
