

1. Introduction
Commercial printouts nowadays are less quantified and more diversified, in response to consumer demand for high quality and diversity. An active measure in printing methods that actively deals with such features is the digital press,1-3) a current trend that greatly differs from the traditional printing methods, such as the inkjet type that uses liquid ink, and the other one that uses the solid toner. Compared to the using toner, the reproducibility of the image from the inkjet method is hugely influenced by the wetting and penetration of the liquid ink.4-6) Especially, since paper is a porous material, its physical characteristics can be altered by the composition of fibers and additives that are added. The color and quality of the printed material are also affected by the same.7)
Therefore, when evaluating the quality of printed material, it is very important to understand the physical properties of paper, more specifically, its surface and structural characteristics directly influencing the printing quality. For instance, if the surface of paper is inhomogeneous, as in uncoated paper, the ink easily penetrates its layer and triggers serious problems.8,9) Moreover, if due to inhomogeneous size and distribution of the filler formed by cohesion between fibers the formation of paper is uneven, then ink penetration becomes inhomogeneous, and causes mottled printing.10-17) Likewise, the physical properties of paper, including density, formation, air permeability, smoothness, and opacity, can be used as scales for comprehending its various pore structures. On this regard, the physical properties of paper are very important to inkjet printing, as the printing quality is directly affected by wetting and penetration characteristics of paper.7,18)
Since the initial distribution of digital press in 2000,19,20) several studies related to the quality of digital printing have been conducted. After the mid-2000s, such studies focused on color management by conversion of the ICC (International Color Consortium) profile for digital image processing, and the features of image quality in color printers.21-27) Simultaneously, detailed studies on dot reproduction and gloss of digital image became popular, while some centered on the correlation between physical properties of digital printing paper and printing quality, which continues up to this day.28-30) Moreover, with the recent increase in environmental concerns, some studies have suggested the use of materials, such as recycled pulp, as alternative materials for digital printing paper, along with an examination of their quality.31-34)
This study aims to analyze the printing quality characteristics of images formed from five different types of printing paper using both inkjet and toner-type digital press, through a measurement device for optical roughness (OptiTopo, L&W, Sweden), and use such results to investigate the correlation between the physical properties of the digital printing paper and the printing quality. Generally, the quality of a printed material can be represented by color density, trapping, print-through, and dot reproduction. Specifically, the areas of analysis include the type of interaction between the above features, the physical properties of digital printing paper from the generated images, and the differences shown by the images formed by such interaction.
2. Materials and Methods
2.1 Testing materials
For evaluation of the physical properties of paper on the printing quality, five different types of printing paper, which are commercially available in the United States, Europe, and Asia, were prepared with different basis weight, density, and smoothness. The samples were humidified for more than 24 h within 23±1℃ of temperature and 50±2% of relative humidity, in accordance to ISO 187.
2.2 Methods
2.2.1 Analysis of physical properties (smoothness, air permeability, sizing degree)
The basic physical properties of the humidified testing materials were evaluated through measurement of the basis weights according to ISO 536. The densities were calculated by initially determining the respective thicknesses according to ISO 534.
Accordingly, the surface characteristics of the sample papers were evaluated by measurement of roughness with a Parker print surface (PPS) tester, in accordance with ISO 8791-4. Smoothness (in micrometer (μm)), as obtained by the PPS method, represented the difference between the highest and lowest spots on the surface of the paper: the higher the value, the rougher the surface. The homogeneity and size of coagulated fibers formed by cohesion between the paper fibers were evaluated through measurement of the paper formation with a 2D lab formation sensor (Formation tester, Tech Pap. Co. Ltd., France) based on the value of LT: the lower the LT, the more homogeneous the size and distribution of the coagulated fibers. In accordance with ISO 5636-5, the time it took for a predetermined amount of air to pass through was measured to figure out air permeability in the paper in the unit of Gurley sec: the higher the value of Gurley sec, the less air-permeable the paper is, that is, the paper’s pore structure is densified. Moreover, the moisture absorption behavior of the paper was evaluated through measurement of Cobb (60) sizing degree, in accordance with ISO 535. Here, the amount of water absorbed was measured for 60 s.
Furthermore, the roughness of digital printing paper was evaluated by measurement at 90° angle, of the light entering the paper’s surface at 60° angle, to provide an optical analysis of the shadow formed on the surface (OptiTopo), thus, confirming the status of ink transfer on the paper.
2.2.2 Optical characteristics analysis
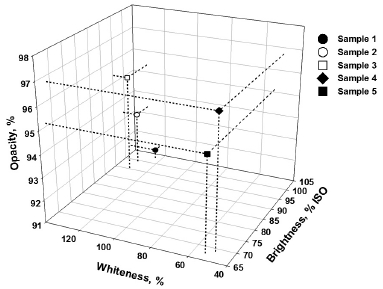
Whiteness characteristic of the five printing paper samples was analyzed using illuminant C, according to ISO 11476 and ISO brightness (Elrepho, L&W) of ISO 2470. Additionally, the opacity of the samples was measured, in accordance with ISO 2471, as an indirect index for comprehending their organizational structure.
2.2.3 Printing test and evaluation
The printing quality was assessed with a liquid-type inkjet printer (HP inkjet printer, USA), and a toner-type laser printer (Samsung laser printer, Korea).
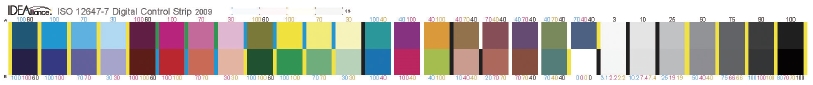
The test was controlled at temperature and relative humidity of 23±1℃ and 50%, respectively, and the printing was performed using a digital control strip, according to ISO 12647-7, as shown in Fig. 1.
Printing quality was measured with a reflection densitometer (X-Rite exact, USA) for securing the objectivity of the concentration method. The reflection rate of each color ink was measured to represent the color density of the printed material,8) while the reflection rate from the backside of the printed material was measured to show the print-through. Ink trapping was measured through a display of the amount of first ink overlapped by the overprinted second ink, in percentages, with respect to Red (M+Y), Green (C+Y), and Blue (C+M) inks. The difference between the objective values and the halftone dots printed as 10%, 25%, 50%, 75%, and 90%, were used to represent the dot reproduction.
3. Results and Discussions
3.1 Analysis on the physical and optical characteristics of digital printing paper
Figs. 2 to 4 show the results of the analysis and evaluation of density, air permeability, roughness, formation index, size, etc. characteristics of the printing paper, for understanding the correlation between its physical properties and digital printing. Digital printing paper samples 1, 2, and 3 were high-quality paper manufactured from bleached kraft pulp and added with filler to improve the physical and optical features. In contrast, sample 4 was a low-quality paper manufactured from recycled pulp fiber, while sample 5 was a middle-quality paper (whose quality was lower than samples 1, 2, and 3) with the fiber composition of natural chemical pulp and partially had a recycled pulp fiber.
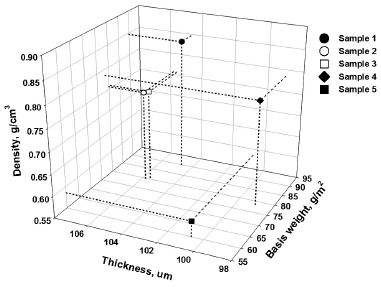
Fig. 2.
Correlation between thickness, basis weight, and density for each sample of digital printing paper.
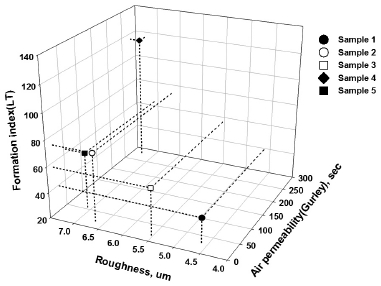
Fig. 3.
Correlation between roughness, air permeability, and formation index of the digital printing papers.
The physical properties of the five printing paper samples, including thickness, basis weight, and density factors, are shown in Fig. 2. The five papers could be largely divided into two groups, depending on the kind of raw fiber material. Samples 1, 2 and 3, composed of bleached kraft pulp, showed similar basis weight. Nonetheless, apparent density was highest in sample 1, while the highest density was indicated in sample 4, due to its very low thickness relative to its high basis weight, although made from recycled pulp. The lowest density was exhibited by sample 5, as shown by its basis weight to thickness ratio.
Correlation among the roughness, air permeability, and formation index of the digital printing papers is indicated in Fig. 3, which shows the apparent differences between each type of paper, depending on the composition of raw fiber material. Sample 4 showed high roughness, high permeability, and high formation index; thus, it showed features that are worst suitable for the printing quality. Relatively, sample 1 showed the lowest roughness, air permeability, and formation index, and was therefore viewed to have the best physical properties for the printing quality. Sample 3 was deemed as good, in roughness, air permeability, and formation index, while samples 2 and 5 showed good air permeability and formation index with relatively high roughness.
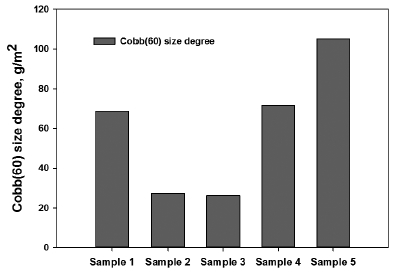
Results of Cobb size degree, which represents the waterproofness of the digital printing paper, are shown in Fig. 4. Samples 2 and 3 exhibited excellent figures of 26-27 g/cm2, whereas sample 5 had the lowest value, at 105 g/m2. Such waterproofness of the printing paper was related to the physical structure of the paper, although it was more closely related to the degree of sizing process during the manufacture. In other words, sample 4, which was manufactured from recycled pulp fiber, exhibited worse air permeability and waterproofness than samples 1 through 3, which were manufactured from natural pulp. Especially, air permeability and formation index in sample 4 were very high, due to its fiber composition; thus, it is expected to further influence the digital printing quality in a negative way.
As discussed in the preceding sections, the digital press, which can be represented by toner or inkjet-based printing, can be viewed as highly related to the raw material composition and the physical organization structure of the printing paper. During web forming, the use of natural chemical pulp and recycled pulp can alter the cohesion behavior of stock and the pore structure of the paper. Thereby, the physical properties of density, air permeability, and formation index of the printing paper can be affected, which ultimately influences the quality of digital printing.
Fig. 5 shows the characteristics of whiteness, brightness, and opacity of the digital printing paper. Note that samples 1 through 3 reflected high whiteness and brightness, due to their natural chemical pulp composition, whereas samples 4 and 5 showed less of these characteristics. Samples 2 and 3, which are high-quality paper and which contain high amount of filler, likewise showed high whiteness and opacity. Additionally, samples 4 and 5 had low whiteness but high opacity, due to the recycled pulp fiber.
3.2 Quality of printed materials
3.2.1 Ink color density
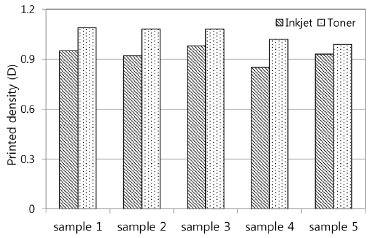
Figs. 6 through 9 show the ink concentration for each color ink. No major differences in color density were observed for samples 1, 2, and 3. On the opposite, the color density decreased for samples 4 and 5, whose respective roughness were 7.25 and 7.05 μm, respectively. The transferred ink in the paper with rough surface penetrated the paper after filling up the irregular surface; thus, more ink was required for achievement of a more homogeneous color density. Nonetheless, as the same amount of ink was provided to each paper by the inkjet, the rougher surface of the paper resulted to lower color density.
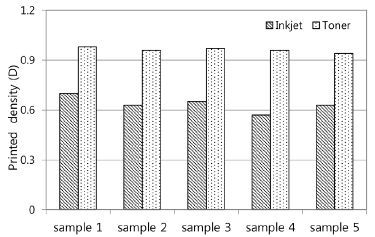
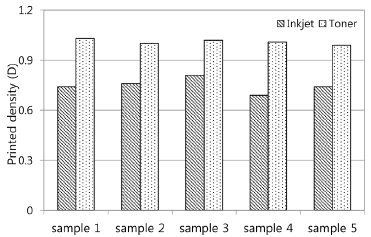
Sample 5, whose waterproofness is among the worst and whose Cobb size degree was 105 g/m2, had relatively low color density, which can be attributed to the higher amount of ink penetrating through the inside of the paper, along with the influence on print-through.
The color density of the printed material was better in toner printing than in liquid-type inkjet printing, which can be attributed to the ink penetration in the latter occurring after wetting, while penetration was less in the former, thus, more toner remained on the surface and a higher color density was achieved. Nevertheless, sample 4 showed low color density even in toner printing, due to its high roughness that caused much surface irregularity.
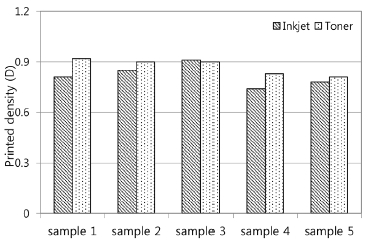
Fig. 8 describes the slight color density difference between inkjet and toner printing in terms of yellow ink, which indicates its higher transparency compared to the other inks. Apparently, yellow ink density was highest in sample 3, seemingly due to the influence of the sample’s highest whiteness value.
3.2.2 Print-through
Figs. 10 and 11 illustrate the naked-eye observations on the front and back sides of the printed materials, which confirmed remarkable levels of print-through on the magenta and black solids. Apparently, the print-through was inversely proportional to color density, and the color reproduction presented by the liquid-type inkjet printing showed more print-through than toner printing. Seemingly, this was due to wetting of the liquid ink into the digital printing paper, as well as to the capillary penetration caused by the porous structure of the paper.
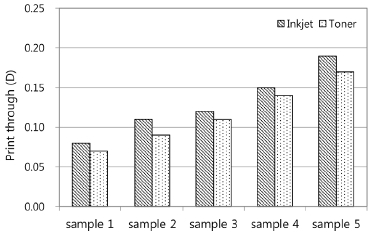
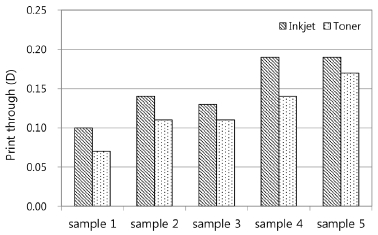
Black ink penetrated more in sample 2 than in sample 3, causing more print-through, as the formation index, which shows the physical properties of the digital printing paper, in the former was 74.1, higher than the 57.7 in the latter, indicating that the inhomogeneous formation resulted in the same result. Samples 4 and 5, which were less waterproofed and whose respective Cobb (60) size degrees were 71.51 and 105.13 g/m2, showed more print-through than the samples 2 and 3, which were more waterproofed and whose respective Cobb (60) size degrees were 27.32 and 26.24 g/m2. Especially, in the case of the black ink, the print-through in sample 4 was almost the same as that in sample 5, which can be viewed as an influence of density and air permeability. Additionally, although sample 4 had higher density than sample 5, as in the results in Figs. 2 and 3, the latter had air permeability of 273.5 s, which was much higher than 49.8 s for the former. Moreover, as sample 4 was made of recycled pulp, the fiber length was short, and the paper’s pore structure became thinner with surfactal hornification. On this basis, the velocity at which the same amount of ink penetrates increased, causing more print-through.
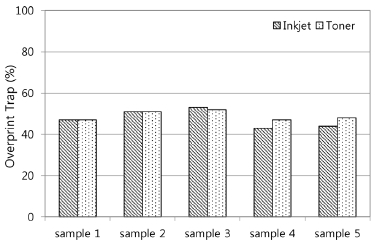
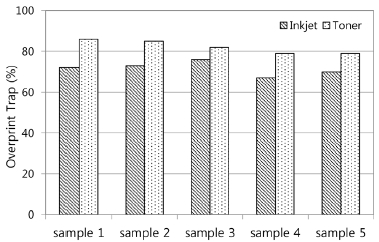
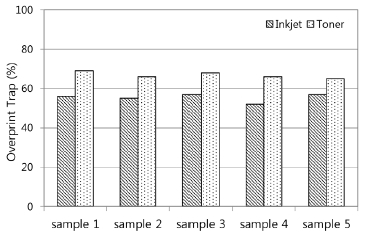
3.2.3 Ink trapping
Generally, the color of a printed material is materialized by the ink. While the ink uses subtractive mixing, in dot reproduction halftone dots of various colors are merged by the reflection of light, and are thus expressed into neutral color. This expression of color is called ink trapping. Figs. 12 through 14 show the measurement of trapping, with respect to colors of R(M+Y), G(C+Y), and B(C+M). The high trapping values showed that the second ink was well attached to the first ink. However, note that G(C+Y) color showed higher rate of trapping than R(M+Y), even in the case of an over-trapped yellow, which indicates the influence of the filter used during the measurement. All measurements used the complementary color filter with respect to the yellow ink, which overlapped the first ink, causing filter interference even at the same wavelength. Furthermore, relative to the ISO-defined rate of trapping for a commercially used web ink, the proper trapping percentages are 89% in G(C+Y), 50% in R(M+Y), and 50% in B(C+M). Therefore, the results of the dye-type inkjet, particularly, 47.8% R(M+Y), 71.6% G(C+Y), and 55.4% B(C+M), on average, can be viewed as proper trapping. Additionally, considering that the rate of trapping in the toner printing was 7% higher than that for inkjet printing, the trapping rate for color reproduction was more likely related to the adhesion between the ink molecules rather than to the physical properties of the digital printing paper.
3.2.4 Dot reproduction
Dot gain occurs due to the influence of the amount of ink remaining on the surface, or the pressure applied during the printing process. This phenomenon often occurs when the dot is at 50%. Fig. 15 shows the dot gain occurring in most of sample 1, due to its relatively higher size degree than all other types, which influenced liquid permeation resistance. Moreover, sample 1 had relatively higher color density result than the others. Thus, the dot gain in sample 1 could be viewed as an effect of the large amount of ink that remained on its surface. Likewise, sample 5, whose size degree of 105 g/m2 was the highest, showed relatively high dot gain, seemingly due to the spread of ink that remained after it penetrated the paper. Therefore, the printout of sample 5 can be noticed, even with naked eyes, with poor image reproduction. On the contrary, sample 4 exhibited the lowest dot gain, as in the result of the actual color density, where it had the lowest. For the same reason, the amount of ink in sample 4 could be inferred as relatively low, thus, the causes of dot gain were relatively less than the other samples.
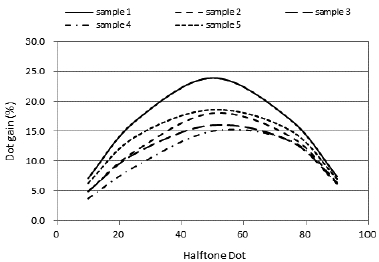
However, the test confirmed that reproduction of the printed material was not seriously affected by the dot gain, as the dot gains in all samples did not exceed 32%, which is the allowable figure.
3.2.5 Roughness of the digital printing paper and image reproduction
Fig. 16 shows the roughness of the digital printing papers, as measured by the roughness measurement device (OptiTopo), along with a comparison of the surfaces of the solid and dot printed materials using black ink, whose molecule size was the smallest of all the inks. Sample 3 showed the least roughness, while sample 4 showed the most. Overall, the image reproduction of inkjet printing was worse than that of toner printing, as could be attributed to the relatively higher dispersivity of the toner ink than that of inkjet. Moreover, as the toner ink was fused and heat-solidified, the surface momentarily smoothened during solidification, which occurred after its attachment onto the rough surface of the digital printing paper. However, due to high permeability reaching 273.5 s, sample 4 yielded an opposite value. This indicates that at high air permeability, the measured OSD (OptiTopo Surface Deviation) value would be low, while the actual color density would decrease as less ink remains on the surface during ink penetration, given the same amount of ink. In contrast, the pigment of toner indicated no fluidity, and thus, a large amount of pigment remained on the surface, thereby affecting the surface roughness and causing high OSD value. Fig. 17 the optical microscopic images of the paper’s surface and after the ink transfer, verifying such results. Note that sample 4 showed unstable ink transfer. Additionally, the roughness of the digital printing paper is shown in Table 1, where sample 3 showed the least distribution of crater and hill at 5 μm, indicating its surface being the most smooth of all samples. Conversely, sample 4 showed the most crater and hill of 5 μm. On this basis, the transferred ink was most homogeneous in sample 3, which had the smoothest surface, whereas it was most inhomogeneous in sample 4, having the worst smoothness.
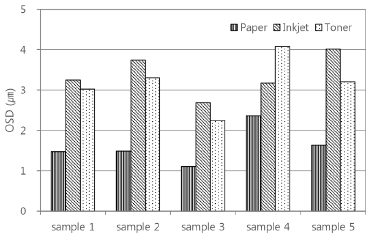
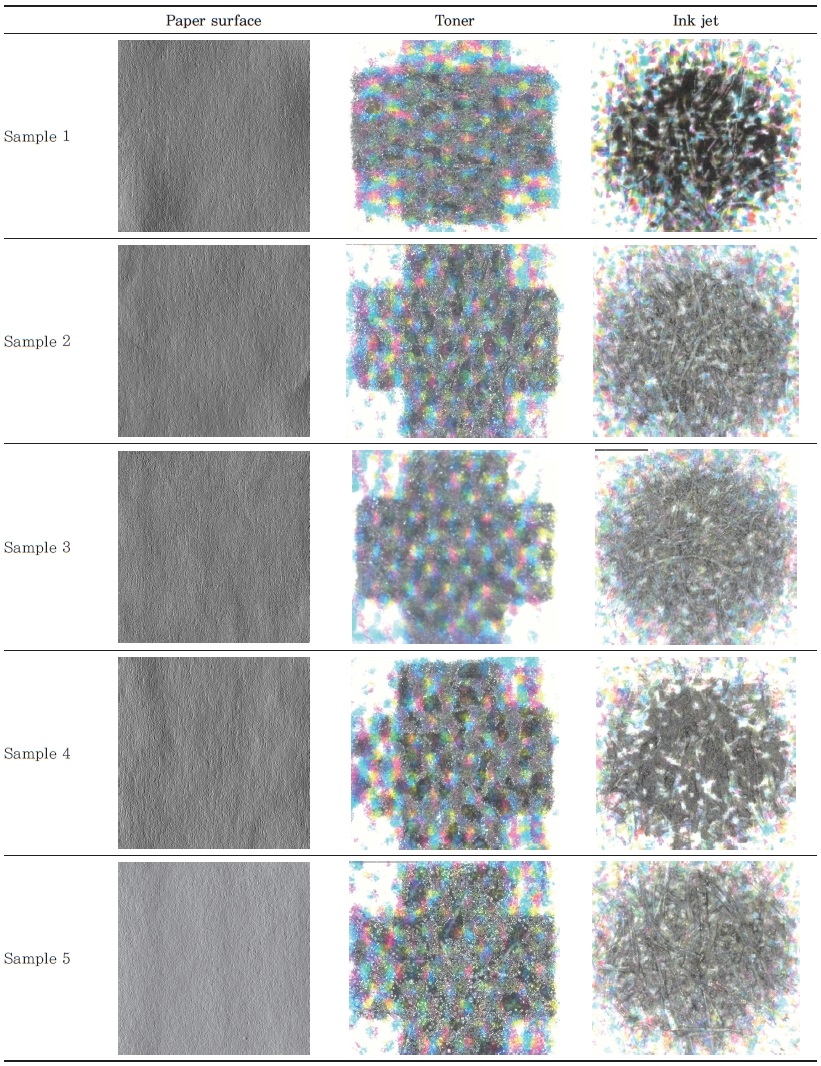
Fig. 17.
Ink transfer on the surface of printing paper, and printed material obtained by optical image analysis.
Table 1.
Crater and hill of printing paper obtained by optical image analysis
4. Conclusions
A comparison of the physical and optical properties of five different samples of digital printing paper was used for an analysis of correlation between the paper’s properties and the color density of printed the materials. As such, the printing paper manufactured from natural kraft pulp indicated relatively high density, while those mixed with recycled pulp showed poor values. The printing qualities of samples 1 through 3 were similar, while those for samples 4 and 5 reflected low color density. Similarly, ink transfer on the surface, as shown by the optical image analysis, showed the same trend. Therefore, given the same amount of ink, the color density is confirmed to be directly influenced by surface irregularities due to printing paper roughness.
Accordingly, toner printing showed better printability as compared to inkjet printing, which shows wetting and capillary penetration on the digital printing paper having a porous structure. Therefore, the solid-type toner printing would leave less ink on the surface of the paper. Moreover, the print-through of the digital printing paper is influenced by density and air permeability, and occurs more often in inkjet-printed materials. The trapping is related to cohesion between the ink molecules, rather than to the properties of the digital printing paper. When provided with the same amount of ink on the printing paper, dot reproduction is better with a high amount of ink remaining on the surface, as less penetration occurs. Further, dot gain is triggered by wetting, when the amount of ink remaining on the surface is large.
Therefore, the relative, quantitative values, with respect to the properties and printability of the digital printing paper that were derived in this study confirmed the bearing of factors, such as the paper’s pulp composition, density, air permeability, and roughness, on the printing quality of the digital printing paper. Such results would be a good future reference for further studies on this subject.
