

1. Introduction
Korea ranks fifth in the world in paper production, with an annual output of 11,662 M/T. Annual paper consumption per person is 197.5 kg/year, which makes Korea’s paper consumption 12th in the world as of 2014. Paper consumption is expected to increase continuously because of the increasing national income and cultural development. However, paper mills have been forced to cut costs because of a lack of resources and a rise in oil prices. In particular, the decline in global resources and a monopolization of resources by China has led to record-high prices for wood pulp, which is the main material of paper. Korean self-sufficiency in attaining pulp is less than 20% of the current need.1,2) Moreover, woodchips used to attain pulp are mostly imported. Accordingly, paper mills are increasing the quantity of low-priced pulp using a ratio with relatively low whiteness by decreasing the use of high-priced, high-quality pulp.3,4) To solve the problem of deteriorated whiteness, paper mills regularly use a fluorescent whitening agent (fluorescent pigments, optical brightness agent, OBA).5-8) Also, with the increase in recycling and environmental problems, interest is growing in the use of recycled paper, which partially or completely contains recycled pulp. Korea is producing newspapers, corrugated cardboard, and toilet paper made entirely from recycled pulp.9) Yet recycled paper is rarely used to manufacture high-quality printing paper3,4) both because domestic corporations that produce printing paper have insufficient capacity to process wastepaper and because limited interest in recycled paper is seen from individuals and the government.4)
Faced with intensified competition in domestic and overseas production of printing paper, Korean paper mills have begun promoting the maximization of earnings rate-to-cost by producing high-quality new, wood-free printing paper. One such example is eco-friendly textbook paper mixed with deinked recycled pulp. In this way, the use of fluorescent whitening agents for textbook printing paper will not only be impossible to avoid, but it will also greatly increase the price of paper.10)
This research tested for hazardous heavy metals in recycled paper and paper stock produced in domestic paper mills and checked for other chemical residues that could be harmful to human health.11-13) Currently, in Korea, no regulated minimum value is established for fluorescent whitening agents nor has sufficient research been conducted on the toxicity of these agents.6,14,15) Determining the amount of ink residue contained in recycled paper as well as the extent of harmful chemical residue that results from the deinking and bleaching processes is necessary. This research also determined whether other chemicals added in the process of producing recycled paper remained and subsequently analyzed the organic volatile compounds in the recycled paper and the paper that contains no recycled material to evaluate risk. In the case of volatile organic compounds, we analyzed chloride compounds, including known toxic materials such as benzene and toluene.16–18) Through an analysis of inorganic and organic compounds in textbook paper, we conducted basic research into changes in eco-friendly printing along with the use of recycled pulp. A textbook can also be determined to be lighter when the basis weight is lowered to 65 g/m2, because the producing basis of eco-friendly textbook paper in Korea is the basis weight of 75 g/ m2 accordingly, this research intended to propose a new standard by conducting a trial production at a domestic eco-friendly textbook paper mill with a 65 g/m2 basis weight textbook paper and by analyzing the material properties. This research also considered the influence of old paper use on printing properties by performing comparative research on printing quality, e.g., printing color reproducibility of the existing textbook printing paper and recycled paper combined with 30% old paper, trapping, contrast, halftone dot reproducibility, gloss, and print-through.19-22)
2. Materials and methods
2.1 Materials
For this research, three types (A, B, and C corporation) of high-quality textbook body paper with an existing basis weight of 75 g/m2 and three types (A-R, B-R, and C-R) of eco-friendly textbook body paper were produced under identical conditions as standard high-quality textbook body paper by adding 30% recycled pulp and three types of eco-friendly textbook body paper with a basis weight of 65 g/m2 (A-R65, B-R65, C-R65). Thus, trial production was performed with a paper basis weight of 65 g/m2. The material properties of each paper were measured based on the TAPPI test method. To evaluate the quality of the printed matter, quality testing was conducted using four-color printing ink [yellow (Y), magenta (M), cyan (C), and black (K)] of D corporation. Table 1 shows the basic material property of each ink color. The tack value of ink was measured using an Ink-O-Meter (KRK, Japan) under conditions of 32°C at 800 rpm; diameter (DM) was measured with a Spread meter (KRK, Japan), which looked at the diameter extended at 25°C for 60 s; and the viscosity was indicated by a Laray viscometer (KRK, Japan) at 25°C.
2.2 Methods
2.2.1 Fluorescent whitening agent content analysis
To effectively analyze fluorescent components, small paper samples were placed in polyethylene bottles after exact weighing, material was extracted for 30 min using ultrasonic waves, and then eluted for 30 min using a shaker (UNION 55R, Korea). Next, analysis was performed with a UV/VIS spectrum photometer (Agilent 8453 UV detector, USA) using only the conflicting liquid with a 0.45 μm syringe filter after centrifuging for 15 min.6)
2.2.2 Hazardous heavy metal content analysis
To analyze four heavy metals such as lead and cadmium, an inductive coupling plasma/mass spectrometer (Agilent ICP/MS-7500, USA) was used following eluting for 1 h using thrice-refined distilled water and a 3% nitric acid solution.11,12) A mercury-exclusive analyzer was used to analyze mercury by minimizing interfering substances. This research intended to minimize errors from pre-treatment in analyzing mercury because direct analysis with the equipment without pre-treatment was available.
2.2.3 Volatile organic compound (VOC) analysis
To establish VOC levels, mainly the printed part of paper was used, and the same type of printed material was used for both the recycled paper and the standard paper. Analysis was performed using a purge and trap gas chromatography-mass spectrometer (Clarus SQ 8C GC-MS, USA) with an absorption-desorption analyzer after inserting samples into a 50 mL vial.17)
2.2.4 Printability test and analysis
The printability test utilized a IGT printability tester (C1, Netherlands) under test conditions of 21.7°C with a relative humidity of 60%. Ink supply was 0.5 cc, print velocity was 1 m/s, and pressure was 200 N to perform a color solid test. Analysis included printing an identical image on each of the nine types of paper of the three companies, including three types of paper from the trial production.19-21)
For the objective printed matter assessment by densitometry, this research measured color density, or the value obtained by reflectivity against the light that is diffused from the printed side of the paper, by using a reflection densitometer (X-Rite 418, USA). In addition, the densitometer was used to measure print-through, trapping, and dot gain, among others.20,22)
3. Results and Discussion
3.1 Standard material property of existing textbook paper and material property of recycled paper
In Table 2, A-HQ, B-HQ, and C-HQ are paper from existing high-quality textbooks; A-R, B-R, C-R, A-R65, B-R65, and C-R65 are paper from six eco-friendly textbooks, the paper of which has a basis weight of 75 g/m2 and of 65 g/m2 by adding 30% recycled pulp. The averages of the results that were displayed through cross-testing of test analysis equipment of each company are indicated to obtain fair results. As gathered from Table 2, no significant differences were found between the comparative measurement results of paper material properties with test production in the paper mill under similar conditions with existing high-quality textbook paper by mixing 30% recycled pulp. However, gloss degree appeared somewhat low at a basis weight of 65 g/m2 most likely because of the agent that was added to maintain the optical property of the basic paper. Yet a lower degree of gloss in textbook paper resulted in improved legibility of printed text. Therefore, recycled paper production based on Good Recycle of Korea (GR) standards, which mixes 30% recycled pulp, is possible to produce, and the quality appears to differ minimally from that of existing high-quality textbook paper.20)
Table 2
Properties of existing high-quality textbook paper and eco-friendly textbook paper
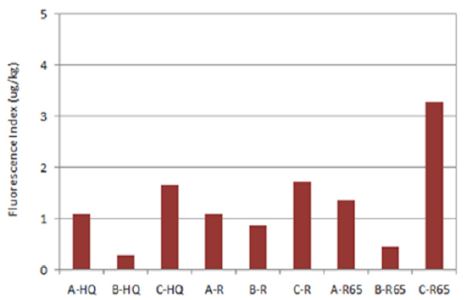
3.2 Distribution of fluorescent material
A comparison between the fluorescent material of high-quality textbook paper and eco-friendly textbook paper indicated that the value appeared slightly higher on average in the eco-friendly textbook paper. However, the value of fluorescent material is lower than the GR fluorescence index standard of 5.0 and is therefore not considered a dangerous level. Although samples B-R and B-R65 were both recycled paper, considering that they displayed lower concentration values than existing paper, the difference was determined to be due to the manufacturers.17)
3.3 Hazardous heavy metal content
Four types of hazardous heavy metals that are harmful to human health when absorbed were analyzed: chrome (Cr), arsenic (As), cadmium (Cd), and lead (Pb). Analysis results are displayed in Table 3. While minor differences were found between manufacturers, the overall detected quantities showed no significant differences between existing high-quality textbook paper and eco-friendly textbook paper. Therefore, the popularity of recycled paper was determined to be the same as that of standard high-quality textbook paper. However, this research compared the standard value used for drinking water and the regulated value of synthetic resin used in food packaging material as no Korean regulation on heavy metals in paper currently exists (Table 4).18) Results were taken following the complete dissolution of paper in nitric acid; therefore, the test was not considered to reflect the makeup of the actual paper. Also, all heavy metals were below the detection limits used for skin contact, and, thus, the papers were determined to be harmless to humans. Furthermore, Cd and Pb levels detected in the paper were lower than the standard for synthetic resin used in paper food wrappers.
Table 3
Hazardous heavy metal content
3.4 Volatile organic material content
Volatile organic material requires particular attention because it can be absorbed into the human body through respiratory organs, even if it is not detected in the wrapped food, when its concentration is high. Fourteen types of volatile organic material were checked, and eight types—chloroform, benzene, toluene, tetrachloroethylene, ethylbenzene, m,p-xylene, o-xylene, and bromoform— were detected. In addition, no significant difference was found between recycled paper and standard paper. The quantity of detected volatile organic material was determined to be at a safe level for humans.17)
Table 5 displays the minimum concentration detected per equipment, and the amount below the detection limit per equipment could not be quantitatively fixed. Therefore, an amount below the quantitation limit, which is a mechanically unquantifiable concentration, was marked to indicate non-detection, i.e., (-).
Table 5
Volatile organic material in each sample
3.5 Results of the printability test
3.5.1 Printed color density
The printed color density of printed material is the value in the antilogarithm function of the value that was measured with reflectivity of the light on the printed caustic side. When supplying the same quantity of ink (0.5 cc), the values of measured ink color concentrations were obtained by using an IGT printability tester, as shown in Figs. 2–5. The printed matter color density value of eco-friendly textbook paper showed a slightly lower tendency than the existing high-quality textbook paper. Deviation per color was 0.084 for black, 0.074 for yellow, 0.200 for magenta, and 0.126 for cyan. However, the difference was within 0.3, and, thus, results of inspection with the naked eye appeared almost similar. In the case of C-R65, a slightly higher concentration appeared than for the other 65 g/m2 basis weight eco-friendly textbook paper. This result is most likely due to the pores becoming relatively small, as shown in Table 2, given the high content of fine fiber; accordingly, a large amount of ink remained on the surface because of the small quantity of infiltration of ink into the paper. However, with the naked eye, no difference was detectable.19,20)
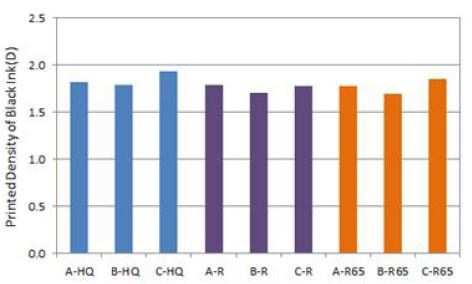
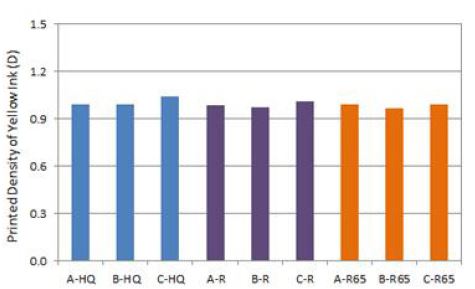
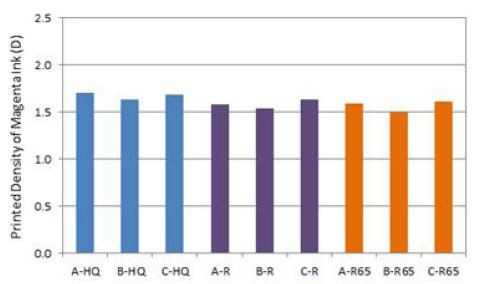
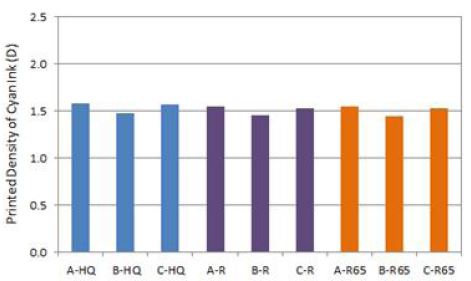
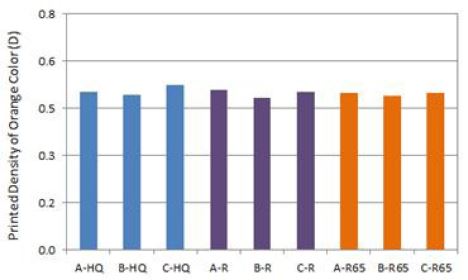
The graphs in Figs. 3–5 show an almost similar tendency of ink color concentration values. In the case of high-quality textbook paper and eco-friendly textbook paper, the sample from B company displayed a slightly lower value. This result is most likely due to the difference in the amount and type of non-wood components added by each manufacturer. However, hue error in ΔE per color displayed no significant difference within 0.1. Therefore, in comparing resulting values from test printing, no significant difference appeared in the standard paper, although ink concentration values appeared slightly lower in the eco-friendly textbook paper or the paper made of recycled pulp with a basis weight of 65 g/m2.
In eco-friendly textbook paper with a basis weight of 65 g/m2, the color concentration deviation appeared equal at 0.01. When comparing the average paper value of the eco-friendly textbook paper with different basis weights, a deviation of approximately 0.034 occurred; thus, almost no color concentration error occurred. Also, considering differences between manufacturers, the type and quantity of the added agents were determined to influence the paper. In addition, no apparent difference in the color density value of each paper was found.20)
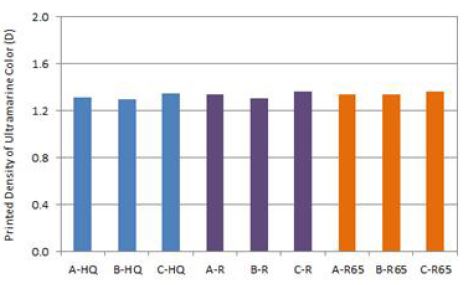
Fig. 7 compares the color density value of the color ultramarine. The C-R sample displayed the highest concentration, and the recycled paper with a basis weight of 65 g/m2 showed almost no difference in color concentration. The average color difference value between papers with different basis weights appeared to be 0.002; thus, they had nearly similar values. Unlike the color orange, ultramarine showed an almost equal color concentration value distribution. However, in the case of dark colors, considering the advantage of checking for deviations with the naked eye as compared with light colors, almost no deviation in textbook papers with different basis weights was determined.21)
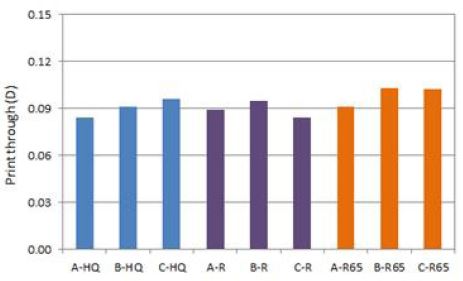
3.5.2 Print-through
Print-through is a phenomenon in which the ink printed on one side of a piece of paper can be seen on the reverse side. Ink visible on the reverse side is referred to as optical print-through, and a clear ink line visible on the reverse side is referred to as mechanical print-through.19-21) When a large degree of optical print-through exists, confusion in information delivery can occur as a result of hindered readability. Also, both printing problems can occur by raising printing trouble as set off because of ink-through when mechanical print-through occurs. Fig. 8 indicates the measured value of the print-through phenomenon with a concentration meter, which appeared during trial printing by supplying an equal quantity of ink.21) The paper that contains recycled pulp and had a low basis weight displayed a high print-through value, averaging 0.012. However, a comparison indicated that the print-through deviation of paper with a basis weight of 65 g/m2, including recycled pulp, was 0.011, and that of paper with a basis weight of 75 g/m2, including recycled pulp, was 0.012, which showed an almost similar deviation. The print-through deviation of high-quality textbook paper was 0.013, and the difference was slightly higher than that at 65 g/m2 because of the difference in or amount of the added agent of each manufacturer.
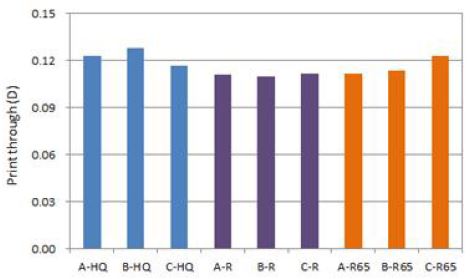
Sample C-R65 showed a relatively higher print-through value, as seen in Fig. 2. The color concentration value was determined to be higher than that of other samples when comparing color concentration values. Therefore, the ink transferred to D-R65 was determined to have a greater transference compared with other papers during trial printing. In the case of A-R65, the color concentration value displayed an almost similar level to B-R65; however, the print-through value appeared low. The ink color concentration of B-R65 was similar to that of A-R65, as seen in Fig. 2; however, print-through appeared relatively more frequently. On the basis of this fact, the paper with a large magnitude of micro-pores was determined to have low concentrations because of the increase of ink infiltration speed, and print-through occurred more often because of the influence of the infiltration speed and the permeability of B-R65 paper or a paper’s internal structure.20,22) However, when observing print-through with the naked eye, the difference was so minor that it could not be detected. Therefore, the paper was determined to be suitable for textbook paper printing.
When comparing the print-through value of high-quality textbook paper, C-HQ was determined to have frequent print-through as the sample with the highest ink color concentration value; however, the sample displayed the lowest print-through value among the high-quality textbook papers. This phenomenon displayed a high ink color concentration because a large amount of ink remained on the surface, and this phenomenon was determined to be due to the relatively small quantity of ink infiltrating the paper.
Fig. 9 displays the print-through value of printed matter using an actual web printing machine. As with the test printing results, the paper with a basis weight of 65 g/m2 displayed a slightly higher print-through concentration value. Among the papers with a basis weight of 65 g/m2, B-R65 displayed a slightly higher print-through value than test printing. This phenomenon was determined to result from two kinds of ink being trapped, causing a greater capillary tube phenomenon. When comparing the result, the overall tendency was at a similar level to test printing; with respect to print-through concentration deviations, the eco-friendly textbook paper with a basis weight of 65 g/m2 averaged 0.111, and the eco-friendly textbook paper with a basis weight of 75 g/m2 averaged 0.092; thus, the deviation appeared minor at approximately 0.018. Therefore, textbook paper with a basis weight of 65 g/m2 was also slightly influenced by print-through.
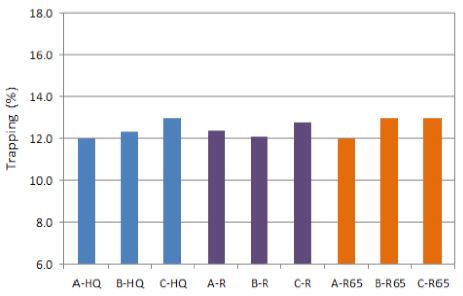
3.5.3 Ink trapping
In general, the color of printed material results from the use of ink. The representation method of ink is subtractive color mixing. However, representation using halftone dots expresses with neutral colors by mixing several halftone colors through light reflection. This color expression is called overlap of ink or trapping.19-22)Fig. 10 shows the trapping value measured for the color orange with a graph, as printed by the actual web printing machine. The point at which the trapping value appeared high indicated that the second ink printed over the first ink adhered well. However, because yellow ink has high clarity, orange represented by placing yellow ink on top of magenta showed a slightly lower trapping value compared with other colors. Therefore, a yellow-biased orange color was displayed. A comparison among the resulting values confirmed that C company’s products (C-HQ, C-R, and C-65R) showed a slightly higher frequency in the basis weight of 65 or 75 g/m2. However, an almost identical value resulted overall. This similar tendency was due to the second raising yellow ink being transferred relatively more often, and the trapping value of magenta ink printed first appeared relatively high. A comparison among the overall results indicated that the color difference by the color of the trapped portion of around 12%–13% was almost nonexistent, and the use of eco-friendly textbook paper with a basis weight of 65 g/m2 is also suitable.
3.5.4 Dot gain
Printing by halftone dot results in the increased size of halftone dots due to the influence of pressure during printing. The opposite phenomenon occurs along with the quantity of consumed ink; however, mostly dot gain occurs as halftone dots increase in size. The dot gain of each color occurs the most in halftone (50% halftone dot). In three-process color during four-color printing, the dot gain balance among cyan, magenta, and yellow ink is important in the overprint color appearance of flesh tones, grass tones, and sky blue, along with gray balance. For example, flesh tone can be expressed red along with the excessive dot gain of magenta. Therefore, to increase the accuracy of ink printed and color representation, reducing the influence of dot gain during printing is desirable.20)
Fig. 11 shows the values of dot gain at 50% dot per paper. In 65 g/m2 basis weight samples, A-R65 was slightly high at 26.67%, and the C-HQ sample was the highest among the 75 g/m2 basis weight samples. In the case of C-HQ, considering that the ink color concentration value was high, as seen in Fig. 2, dot gain was determined to have occurred largely because of pressure since given that the ink layer of the surface became thick as a large amount of ink remained on the paper. Also, the values of textbook paper with a basis weight of 65 g/m2 were confirmed to be lowest among the textbook paper samples that contain recycled pulp. A comparison among deviations that generated dot gain indicated that the eco-friendly high-quality textbook paper had a value of 1.6, the deviation of 65 g/m2 basis weight paper was 1.42, that of the 75 g/m2 basis weight samples were 1.04, and that of the eco-friendly textbook paper that contains recycled pulp had a low deviation value. This slight deviation was determined to result from the influence of the increase in non-wood components (filler) along with the use of recycled pulp to adjust material properties in paper manufacturing.
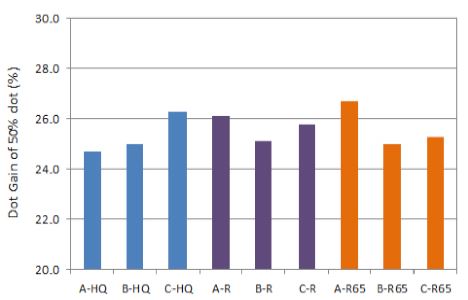
Therefore, dot gain was determined to have occurred slightly in the standard high-quality textbook paper; however, almost no difference existed, particularly in 65 g/m2 basis weight samples that contain recycled pulp. In addition, the deviation per manufacturer was due to differences in filler content and type. However, because the difference was not substantial, it was determined to indicate an almost equal value.
Fig. 12 shows the dot gain result in 75% dot. As the amount of supplied ink relatively increases as the size of dots grows larger, the size of dots can differ along with the surface condition of the paper and the difference in absorbing ability. Considering that surface gloss was high in the high-quality textbook paper, as seen in Table 2, surface smoothness was determined to be relatively low and the shape of dots differed accordingly. However, in the case of eco-friendly textbook paper with 30% recycled pulp, 75% dot showed an almost similar dot shape regardless of basis weight. A comparison between deviation values per sample showed that the value for high-quality textbook paper was 1.3, that for the 75 g/m2 basis weight samples among eco-friendly textbook paper was 0.4, and that for the 65 g/m2 basis weight samples was 1.4; thus, no substantial deviation appeared.
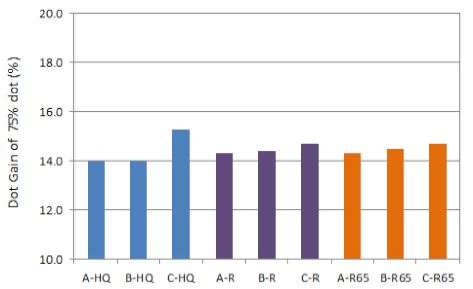
Therefore, the dot gain phenomenon of 65 g/m2 basis weight eco-friendly textbook paper that contains recycled pulp and 75 g/m2 basis weight high-quality and eco-friendly textbook paper did not exhibit a large error range, and the use of 65 g/ m2 basis weight paper was confirmed to be suitable.
4. Conclusions
The results of an analysis of harmful materials and the printability of eco-friendly textbook paper with a basis weight of 75 and 65 g/m2 and contains recycled pulp and high-quality textbook paper with a basis weight of 75 g/m2, which did not contain recycled pulp, are as follows:
Print-through was slightly high in the textbook paper with a relatively low basis weight of 65 g/m2 however, a comparison of the deviation indicated that the deviation of the eco-friendly textbook paper with a basis weight of 65 g/m2 and containing eco-friendly recycled pulp was 0.012, that of the eco-friendly textbook paper with a basis weight of 75 g/m2 was 0.014, and that of the high-quality textbook paper was 0.012. Therefore, 75 g/m2 eco-friendly textbook paper containing recycled pulp appeared slightly high because of differences in the type or amount of agent added per manufacturer and the slight differences in changes to the inner structure of the material. In addition, the eco-friendly textbook paper with a basis weight of 65 g/m2 showed an almost equal deviation to the high-quality textbook paper because of the type of filler and content used to regulate properties, which can be changed as the basis weight decreases. However, the difference indicates a very low amount. Therefore, print-through was confirmed to have a slight influence.
A comparison of the influence of ink trapping indicated an almost equal amount, and a low level of error appeared among the manufacturers. However, according to analysis by the naked eye, almost no difference was noticeable, and, accordingly, no difference due to color trapping was found. Therefore, 65 g/m2 basis weight textbook paper is also suitable.
A comparison of the enlargement ratio of the printed matter dot also showed that deviation per sample was slight because of an increase in nonwood components (filler), which were added during paper production. The dot enlargement rate in areas of the printed shadow part displayed almost no difference. High-quality textbook paper with a basis weight of 75 g/m2 showed a relatively high value, thereby indicating a relatively high amount of ink remaining on the surface as in the color concentration of printed matter. Therefore, the dot enlargement rate seemed to increase because of the influence of pressure during printing, and it aligned with the predetermined result for the color concentration of printed matter because the phenomenon appeared in one sample only. Therefore, 65 g/m2 basis weight textbook paper that contains recycled pulp and 75 g/m2 textbook paper showed almost no difference in deviation.
