

1. Introduction
The modern paper industry is a technology, capital, resource and energy intensive industry, which is developing towards large scale, automation, high efficiency and low energy consumption. Improving paper quality is one of the important directions of independent research and development of paper industry. In the paper industry, the paper defect is that does not meet the quality and technical requirements of paper.1) Some paper defects are caused by poor technical operation or poor technical quality during the process of paper making, while others are caused by poor environmental sanitation in the factory. Some of the paper defects are relatively continuous. If not take measures, the quality of the paper will be more impacted. So, it is necessary to detect, mark or sound an alarm in time.2) Due to the high speed of the modern paper machine, the traditional human visual inspection has been unable to meet the demand. With the development of machine vision technology, the automatic detection with the combination of computer image processing technology and the paper industry has become the focus of research.3,4)
At present, the commonly used methods for detecting paper defects include threshold-based, region-based, edge detection based and specific theory-based segmentation method. Among these methods, the threshold-based segmentation method is favored by many scholars because of its simple calculation, high efficiency and fast speed.5,6)
But for the low contrast paper defects such as folds, cracks and so on, especially when the background texture is disturbed, the threshold is hard to decide, the detection accuracy will be low, which will lead to low detection accuracy, and the phenomenon of missing and false detection will occur. In this paper, a detection method for low contrast paper defects based on artificial bee colony optimization was proposed. And the Visual Studio 2010+Open CV were used to program. The experimental results showed that the method can detect the low contrast paper defects correctly and effectively.
2. The Filtering of Paper Defects Image
Gabor transform was proposed in 1946 by Dennis Gabor. The basic flow of Gabor transform is as follows: Dividing the signal into many small-time intervals, and then Fourier transform is used to analyze each time interval to determine the frequency of signal at each time interval.7) The Gabor filter has the characteristics of local optimum in both spatial and frequency domain, so it can describe the local structure information such as spatial frequency (scale), spatial position and orientation selectivity.8) Frequency and orientation representations of Gabor filters are similar to those of the human visual system, and they have been found to be particularly appropriate for texture representation and discrimination.9)
In the spatial domain, 2-D Gabor filter is a Gaussian kernel function modulated by a sinusoidal plane wave. In image processing, a Gabor filter is a linear filter used for edge detection. 2-D Gabor transform is a good tool for multi-scale representation and analysis of images. Typical 2-D Gabor filter function φ(x,y) is defined as Eq. 1.
Where, σx and σy are the standard deviation of X axis and Y axis, respectively, which determine the size of the filter area. ωx is the frequency of complex sine function on transverse axis.
Gabor filtering of image is making the image I(x,y) convolving with the Gabor function φ(x,y), which can be computed as Eq. 2.
Where * is convolution operation, g(x,y) is the image after Gabor filtering.
In this paper, we used the Gabor filter to filter the low contrast paper defect image to remove the interference of the light and the paper texture, and enhance the contrast of the image. The resultant output was the image where the majority of noise was removed.
3. 2-D OSTU Algorithm Based on ABC Optimization
3.1 2-D OSTU
The OSTU algorithm, also known as the maximum inter class difference method, was proposed by Nobuyuki Otsu in 1979. It is an adaptive threshold determination method. It can automatically select the global threshold value by counting the histogram characteristics of the whole image. This method is widely used in image processing because of its advantages of simple calculation and not affected by image brightness and contrast under certain conditions.10) However, due to the fact that the OSTU algorithm only considers the gray value of the current pixel, when the image is affected by noise interference, the gray histogram is easy to form peak and valley, which leads to the error of threshold calculation and low segmentation accuracy.
Based on the OSTU algorithm, Liu11) proposed a 2-D OSTU algorithm, which is described as follows:
1. Let I(x,y) is the image with gray level of L, f(x,y) is the gray value of(x,y) point, and g(x,y) is the gray value of K×K pixel set with pixel (x,y) as the center.
2. Let f(x,y)=i,g(x,y)=j, a binary (i,j) is formed.
3. Let the occurrence number of binary (i,j) is fij; The probability density of the binary is Pij, Pij=fij/N, i=1,2,…,L; Where, N is the total pixel number of the image.
4. The threshold vector (s,t) divides the two-dimensional histogram of the image into four regions,as shown in Fig. 1. Where A and B are target and background;C and D are noise and edge points.
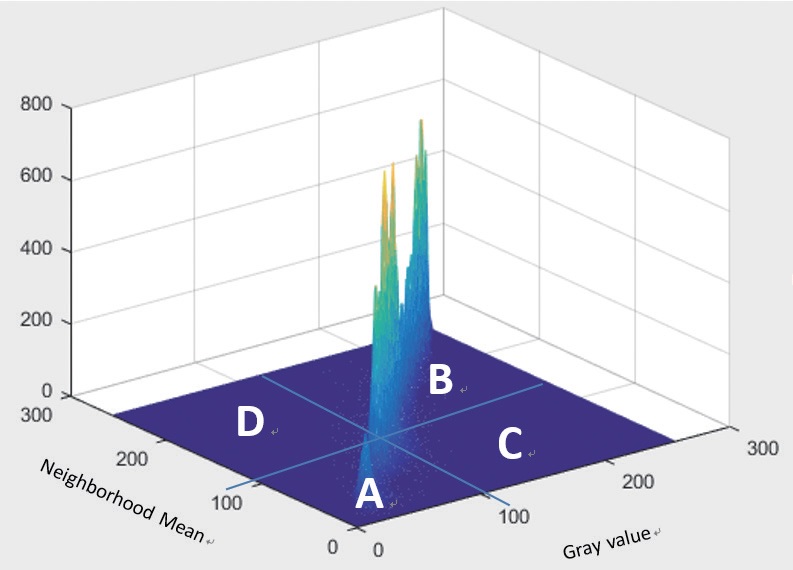
The probability corresponding to the target and background is Po and Pb . When the threshold is (s,t), Po and Pb can be calculated by Eqs. 3-4.
Let Co and Cb are mean vectors of target and background areas,which can be calculated by Eqs. 5-6.
The total gray value CT of the image is shown in Eq. 7:
The dispersion matrix is defined as Eq. 8:
The trace of the dispersion matrix is defined as Eq. 9:
The (s,t) of the maximum trace is the best segmentation threshold.
3.2 Artificial bee colony
The artificial bee colony (ABC) is an optimization algorithm model proposed by Karaboga12) in 2005 to simulate the intelligent search behavior of bee swarm. In ABC, there are three groups of bees: leader bees, onlooker bees and scout bees. Where, leader bees and onlooker bees explore honey source, scout bees avoid too few kinds of honey sources and observe whether the algorithm falls into local optimum.13)
When ABC algorithm is used to solve the optimization problem, the location of honey source represents the feasible solution of the optimization problem. First, generating a set of initial solutions randomly from the feasible region all leader bees search the neighborhood of the initial solution; Then, according to the honey source information provided by the leader bees, onlooks choose the superior individuals to follow and creates new positions. If a honey source is not updated through a predetermined iteration, the honey source is discarded and the corresponding leader bee is transformed into a scout bee.
The algorithm flow of ABC is as follows:
1) Initialization
In the solution space, the initial position of honey source is randomly generated according to Eq. 10,
Where, i =1,2,…,NP; j =1,2,…,D; NP is the number of honey sources; D donates the number of variables, i.e. problem dimension; represent the lower and upper bounds of the jth variable. rand(0,1) represents a random number between 0 and 1.
2) Updating new honey source
Leader bees search for a new honey source near the honey source i according to Eq. 11:
Where, k=1,2,…,NP, k is a randomly selected honey source different from i (k≠i) rand(0,1) represents a random number between 0 and 1.
3) Onlooker bees choose leader bee to follow
After the leader bees complete the search, the honey source information is shared to onlooker bees, and the onlooker bees select the leader bees to follow according to the selection probability Pi, which can be defined in Eq. 12.
Where, fitnessi donates the fitness value of the jth solution, fitness can be defined in Eq. 13.
Where, f(xi) is the value of the objective function f of the problem to be optimized corresponding to the honey source i.
According to the selection probability, the onlooker bees adopt roulette strategy to choose the leader bee to follow, and update the corresponding new honey source. If the fitness of the new honey source is better than the previous one, the new honey source is saved.
4) Sending scout bees
During the search process, once a honey source cannot be ameliorated further during a predetermined cycle (defined as “limit”), the honey source should be replaced with a new one, while the leader bee associated with it subsequently becomes a scout bee. The new honey source is generated randomly according to Eq. 10.
The artificial bee colony algorithm (ABC) has the characteristics of simple operation, less control parameters, high search accuracy and strong robustness. Compared with the classical optimization method, ABC has little requirements for objective functions and constraints, which has few requirements for objective functions and constraints. In the process of search, ABC doesn’t use external information. ABC only takes fitness function as the basis of evolution, which can effectively solve a variety of optimization problems.14-16)
3.3 2-D OSTU algorithm based on ABC optimization
In this paper, ABC is used to optimize the 2-D OSTU algorithm, so as to speed up the search of the best threshold in and improve the accuracy of image segmentation.
The algorithm flow chart of 2-D OSTU based on ABC optimization is shown in Fig. 2.
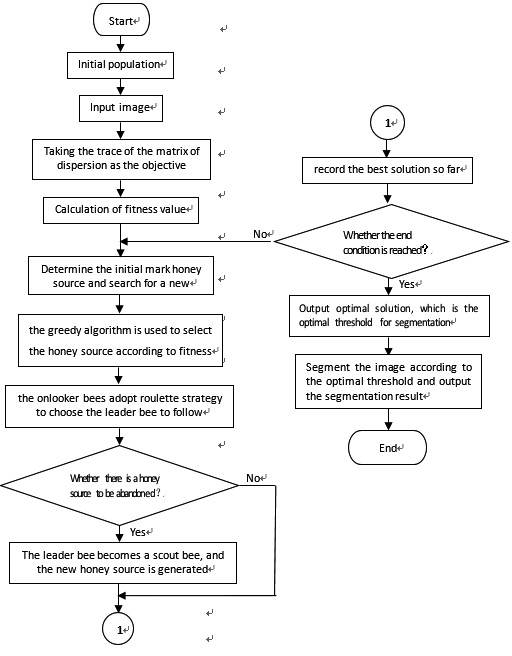
The steps of 2-D OSTU algorithm based on ABC optimization are as follows:
Step 1 Initialize the population number. Input the image to be segmented. Take the trace of the discreteness matrix of the image to be segmented as the objective function, and obtain the fitness.
Step 2 The leader bees randomly generate the initial solution according to Eq. 10 and search for the new solution according to Eq. 11.
Step 3 Lookers follow by according to the selection probability Pi and using roulette method.
Step 4 In the search process, if the solution i cannot be ameliorated further during a predetermined cycle (defined as “limit” in ABC), the solution i is discarded while the leader bee associated with it subsequently becomes a scout bee. In the solution space, the scout bee randomly generates a new solution to replace the original solution i. If the fitness of the new solution is better than the previous one, the new solution will be saved.
Step 5 Repeat Step 2 to Step 4 until the end condition is reached.
Step 6 The output optimal solution is the optimal segmentation threshold (s,t) of 2-D OSTU.
Step 7 According to the best threshold (s,t), the image is segmented by 2-D OSTU, and the segmented image is obtained.
4. Web Inspection Algorithm for Low Contrast Paper Defects Based on ABC Optimization
A web inspection algorithm for low contrast paper defects based on ABC optimization was proposed in this paper. The proposed algorithm flow is shown in Fig. 3.
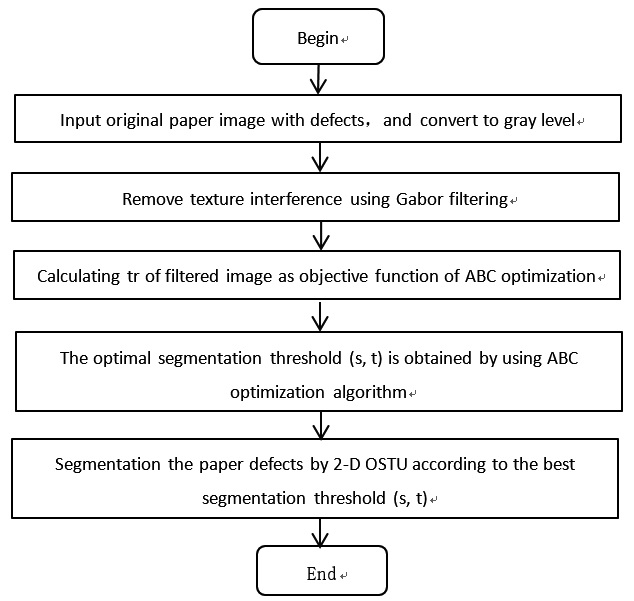
The web inspection algorithm for low contrast paper disease based on artificial bee colony optimization mainly includes the following steps:
1) Capturing the original paper images by the industrial CCD camera and transferring them to host computer. Then translating the original images into gray scale images;
2) Gabor filter as show in Eq. 2 is used for image filtering to eliminate texture elements in the original images.
3) For the filtered image, the algorithm proposed in Section 3.3 is used to segment the paper defect area.
5. Results and Discussion
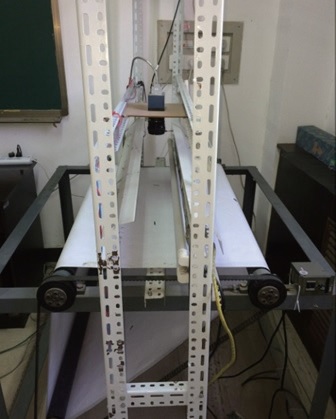
In productive processing of paper, the common paper detects include dirty spots, holes, cracks and folds. Among them, the dirty spots and holes belong to relatively high contrast paper defects, cracks and folds belong to low contrast paper defects. The four kinds of paper defects are used as the test objects in the paper. The paper defected images were collected from the laboratory testing equipment and the paper obtained from the paper production line is used to, which is showed in the following Fig. 4. Programs are compiled by Visual Studio 2010+Open CV to compare the proposed method with OSTU and 2-D OSTU algorithms. The original image with the four types of paper defects respectively and the detected results using the proposed method were show in Table 1.

The proposed method is compared with several methods traditional, such as OSTU and 2-D OSTU algorithms. In the experiment, 11 cases of dirty sports and holes, 25 cases of cracks and folds and totally 72 cases of paper defects of various shapes and size were detected and compared. The contrast results are shown in Table 2.
Table 2.
Comparison of the detection Accuracy (%) for different algorithm
| Paper defected types (total image) | OSTU | 2-D OSTU | Proposed | |||
|---|---|---|---|---|---|---|
| Correct | % | Correct | % | Correct | % | |
| Dirty Spots (11) | 10 | 90.91 | 11 | 100 | 11 | 100 |
| Holes (11) | 9 | 81.82 | 10 | 90.91 | 10 | 90.91 |
| Cracks (25) | 19 | 76 | 21 | 84 | 23 | 92 |
| Folds (25) | 20 | 80 | 22 | 88 | 23 | 92 |
From the Table 2 results, it can be seen that for the dirty spots, due to the high contrast, the accuracy of the three algorithms is higher, reaching more than 90%. For the holes, when the holes are small, the threshold value of OSTU and 2-D OSTU algorithm depends on the artificial experience completely, so it may be missed when the threshold value is not appropriate. However, the detection accuracy can also reach 80%, which basically meet the needs of industrial processes. But for cracks and folds, the accuracy of OSTU algorithm is low, which is less than 80%. The correct rate of 2-D OSTU algorithm is higher than OSTU, can reach about 85%. The accuracy of proposed method compared with the traditional algorithms has been greatly improved, can reach about 92%, which satisfy the need of industrial production process.
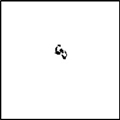
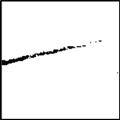
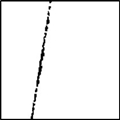
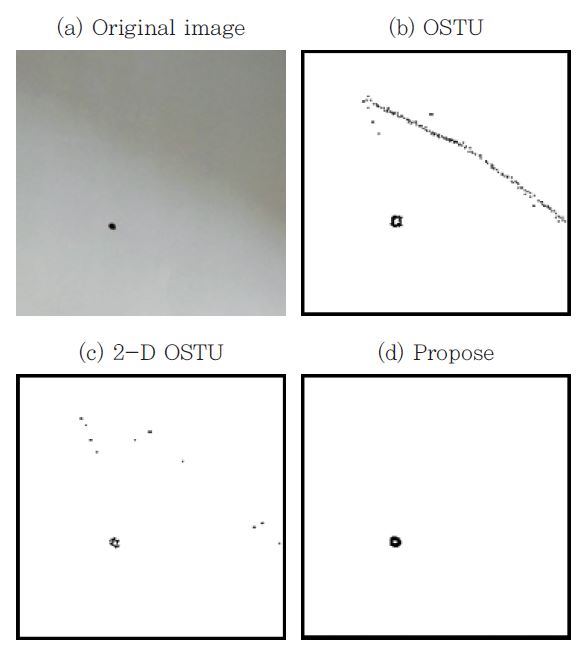
Further analysis of the experimental results can be drawn that for the dirty spots and holes which with higher contrast, the correct rate of the three algorithms is very high, and only when the dirty spots or holes are too small, the OSTU and 2-D OSTU algorithm will miss detection. As for folds and cracks, when the folds and cracks are obvious and the areas are large, the three algorithms can be accurately detected. When the folds or cracks are mild, the correct rate of OSTU is obviously decreased. When the contrast of paper defects is low and disturbed, as shown in Fig. 5(a), OSTU and 2-D OSTU algorithm will detect false edges (shown in Fig. 5(b)-(c)) because of that it is susceptible to be disturbed by the noise, which will lead to a decrease in the accuracy of the test results. The algorithm proposed in this paper can effectively remove the interference of paper texture and guarantee the accuracy of detection, which is shown in Fig. 5(d).
6. Conclusions
In this study, a new method for low contrast paper defects detection is proposed. Firstly, the Gabor filter was used to eliminate the texture elements and enhance the contrast. Then, the optimal segmentation threshold of 2-D OSTU is obtained by taking the trace of the dispersion matrix of the filtered paper disease image as the objective function of the artificial swarm optimization. Finally, according to the best segmentation threshold, the paper image is detected by 2-D OSTU method. It is proved that for the low contrast paper defects, the method proposed can effectively resist the disturbance of paper texture, and the detection accuracy is high. At the same time, for the high contrast paper defects, it still maintains high detection accuracy.
At present, the method is only tested in laboratory equipment. If the speed of the production line is further improved, whether it can be detected in real time needs further verification. On the other hand, the algorithm is only used in the paper defect detection system of white board at present. The detection of brown paper and other paper defects is the next step to be improved.
