1. Introduction
Refining is an energy intensive process in the pulp and paper industry. The spindle power of a disc refiner is transferred to the refining area through the bars of the plate and the morphology of the pulp fibers is changed by the mechanical friction between the bar and fibers or between the fibers themselves to achieve specific pulp properties. The refining intensity of the refiner is greatly influenced by the bar structure of the plate, which plays an important role in changing the pulp properties and fiber morphology.
Many studies have conducted quantitative analyses of the refining process to find an accurate intensity to measure refining based on energy. Brecht1) proposed specific refining energy (SRE) to represent the net energy consumption of a unit mass of absolutely dry pulp, which is widely used in mills; however, this measure is not the most effective means to measure the intensity of the refining process because it just represents the amount of energy consumed and does not reflect how it is consumed.
Wultsch et al.2) took into account the number of bars, their average length, and the rotation speed of the disc to propose the “spezifische Kantenbelastung”. Brecht et al.3) presented a new concept, namely, cut edge length (CEL), and made an improvement on Wultsch’s work with the specific edge load (SEL), which is widely used today. The SEL is defined as the energy consumed per unit bar cut edge length, and the CEL is considered an effective parameter when using the SEL to describe the refining process. Lumiainen,4,5) Meltzer et al.,6,7) Musselman et al.8) accounted for many bar parameters, such as the bar width and angle, which are not considered in the SEL, and defined the special surface load (SSL), modified specific edge load (MEL) and modified specific surface load (MSSL) based on the SEL. Roux et al.9) modified the SEL by accounting for additional geometric parameters and identified the reference specific load (RSL) by replacing the CEL with the reference length Lref. The four intensities mentioned above are all based on the SEL and generate a further extension of the SEL, known as SEL-based refining intensities by Liu et al.10)
Some researchers have proposed a new way to qualify the refining process by considering the energy consumed from a single impact to the fiber through the unit bar length. Lewis and Danforth11) proposed that the SRE of the refining process is the product of the impact number N and the impact intensity I of the plate on the fiber, and determined that the formulas for the dimensionless quantity N and the fiber intensity I which are inaccurate. Leider and Nissan12,13) deduced more accurate expressions for N and I. The variable I is estimated by measuring the energy required to stretch the fiber to its elastic limit, and N is calculated by estimating the residence time of the fiber in the refining area. Kerekes14) used the C factor to characterize the ability of a refiner to apply an impact to the fibers and derived formulas for N and I based on many refining process parameters, such as plate parameters and gap and fiber properties. This approach is the most rigorous and accurate of all the refining intensities. However, the calculation of C factor in steady state is normally complicated and made more complex by the dynamic nature of the actual refining process. Therefore, the C factor can only predict an average value and cannot be used for real-time monitoring of process parameters, which limits its practical application. Andritz proposed the MagnusTM theory, which describes the refining process using two parameters: the compression index and the number of treatments.15-17) According to this theory, the refining effects of the bar on the fiber are classified by cutting, squeezing and brushing. This theory shows that using the reasonable groove, bar and gap parameters can improve the quality and efficiency of refining.
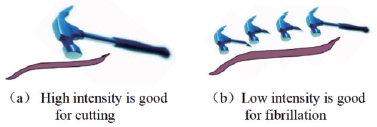
The refining process can be classified as being high or low intensity. As shown in Fig. 1, low intensity refining can further increase the specific surface area of the fiber by promoting the internal fibrillation of the fiber and increase the strength of the paper. However, external fibrillation of the fibers is promoted and greater cutting occurs during high intensity refining, meaning that the strength and length of the fibers decrease as the printing performance of the paper improves.
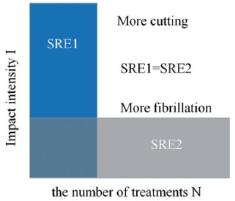
Kerekes18) concluded that some definition of the refining intensity is the machine intensity and others provide fiber intensity. For machine intensity, such as SEL, SSL, etc., the result of the refining process depends on the strength of them. When considering the SEL, a value of 3-5 J/m is suitable for pulp with long fibers, and strong cutting effect on the fibers occurs during high intensity refining. An acceptable range for low intensity refining of short fibers is 0.5-2 J/m, which results in a better fibrillation effect.19) However, for fiber intensity, the SRE is the product of N and I when the fibers undergo continuous refining, meaning that different refining effects can be obtained for different N and I values that still yield the same SRE,20,21) as shown in Fig. 2.
Previous research on refining intensity has mainly focused on the machine intensity, as represented by the SEL. However, some studies have examined the refining intensity from the fiber perspective, which requires further study. The focus of our research is to seek a reasonable refining intensity to predict or measure the changing properties of pulp fibers, such as the beating degree, average fiber length, etc. The characterization parameters for the refining intensities and BI-based refining intensities are proposed in this article, and the characterization performances of six refining intensities are obtained using data from a previous study.22,23)
2. Materials and Methods
2.1 Characterization parameters of refining intensity
The machine intensity is broadly defined in Eq. 1 as:
where Pnet represents the net power, n is the rotation rotor speed, and A is a relative parameter called the characterization parameter of refining intensity.
The intensity of the refining process is very complex and can be influenced by many factors, including the design variables of the disc refiner, control parameters and pulp properties. Most of the measures of the refining intensity use plate parameters, such as bar width, bar height, groove width, etc., as starting points. By analyzing the refining intensities, studies of characterization parameters can be carried out through two aspects: the characterization parameter based on the SEL and the characterization parameter based on the BI considering the status of the plate.
2.1.1 Characterization parameters based on CEL
Brecht et al.4) proposed the SEL theory to characterize the effect of the plate on the fibers, as described by Eq. 2:
where Pnet is the net power consumed during refining, n is the rotation speed, Zs and Zr are the number of rotor and stator bars, respectively, and L is the average length of the bars.
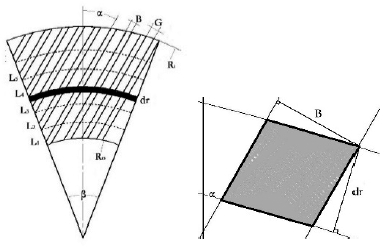
The variable ZsZrL is the cut edge length (CEL) and is a characterization parameter of the SEL via a comparison to the definition of A in Eq. 1. The calculation of the CEL is defined in Eq. 320) as:
where r is the radius of the plate.
Only the effect of the bar edge is taken into account in the SEL, and other plate parameters, such as bar width, groove width, disc radius, etc., are not taken into consideration. To make the SEL more complete, Lumiainen5) proposed the new SSL, MEL, and MSSL intensities based on plate parameters, such as the bar width and bar interaction angle γ. By similar methods, the characterization parameters of these intensities can be obtained, as shown in Table 1. The characterization parameters of the SSL, MEL and MSSL are extensions of the CEL and are still based on the CEL. The characterization parameters of the SSL and MSSL are the same for the same rotor and stator parameters.
2.1.2 Characterization parameters based on bar interaction
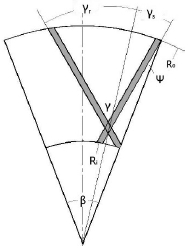
The bars and grooves of rotor and stator that intertwine with each other exert shearing and squeezing effects on the pulp or fibers during refining and result in changes to the fiber morphology. Therefore, it is particularly important to analyze the refining intensity in terms of the bar interactions. Elahimher et al.22,23) studied the bar interaction process for the first time at the mosaic point and deduced the parameters of the bar interactions.
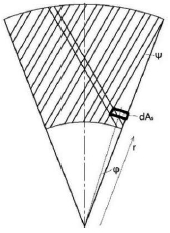
Assuming that the total area of the disc is the working area AT and the bar interaction quadrilateral is defined as ASC, as shown in Fig. 3, then the interaction point N is calculated by Eq. 4:
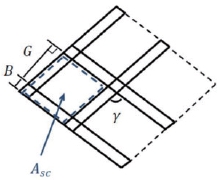
Using the definition of bar interaction quadrilateral, the sum of the perimeter and area of all bar interaction quadrilaterals are defined as the bar interaction length and area, which can be obtained Eq. 5 and Eq. 6, respectively:
Elahimher believes that the entire area of the disc is effectively refining area when refining, but another results obtained by reasonable analyses and simplification of the actual bar interaction process present in this paper, which is elaborated on below.
2.2 Modeling the intensity based on the bar interactions
2.2.1 BIL and BIA
During the actual refining process, the pulp fed into the gap between the rotor and stator is continuously squeezed and sheared under the action of the edge and surface of the bars, which changes the fiber morphology. Therefore, defining the bar surface area (BIA) as the refining area would be more accurate than using the total disc area.
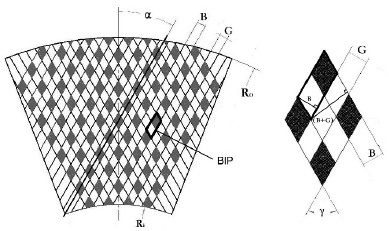
The bar interaction parallelogram (BIP) formed by the interaction of a single bar on the rotor (or stator) and the adjacent groove on stator (or rotor) is defined as being composed of two interaction points: a bar interaction point and a bar and groove interaction point. The sum of the adjacent two sides of the bar interaction point in the BIP is defined as the single bar interaction length CBIL. The single bar interaction area AB is the area of a single bar interaction point. These variables can be obtained by Eq. 7 and Eq. 8, respectively:
By calculating the effective refining area Ae, the total number of bar interaction points NT of the refining area can be calculated by Eq. 9:
The BIL and BIA of the entire refining area can be expressed by Eq. 10 and Eq. 11, respectively:
where H and X1 are functions describing the bar profile of refining plate. The detailed derivation process associated with BIA and BIL is shown in Appendix A.
2.2.2 The refining intensity based on the bar interactions
The refining intensity characterizes the degree of the impact on the pulp or fibers during refining. The SEL defines the bar edge as the effective part of the plate, and the bar edge and width are concerned by the SSL, which makes a improvement to the SEL. Many SEL-based refining intensities have been proposed considering the patterns of bars and grooves to modify the SEL. However, confirming the bar interaction parameters is more important for refining through the analysis of previous studies and the refining process. The BIA and BIL that characterize the bar interactions can be obtained in this way, and the refining intensities are established considering the general formula for refining intensity.
The refining intensity based on the bar interaction area BIA can be expressed as follows:
and the intensity that considers the BIL is defined as:
2.3 Experimental
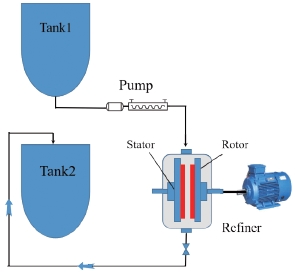
To analyze the characterization of the different refining intensities for the refining process, the experimental data mentioned in Appendix C of reference 23, which were obtained from a 16-inch single disc refiner with a variable speed drive that can be adjust to 800, 1000 and 1,200 rpm using 3% CTMP pulp (Quesnel River Pulp), were used in this paper, and the initial beating degree of the pulp was 32.8 SR°, the average fiber length was 1.9 mm. All the trials were conducted at the same conditions, namely, the stock temperature was held constant at 60℃, and the flow rate was 250 rpm. A low consistency refiner was used in these experiments and is shown in Fig. 4.
The power was varied over practical plate gap ranges with a minimum of 15 samples collected per trial to provide repeatability and high resolution. The trials were run at three (3) different rotational speeds (as mentioned above) and for a wide range of plate geometries. The fiber lengths and the beating degrees of the pulp were measured by a Fiber Quality Analysis and CSF tester. The refiner is equipped with flow meters, power meters, and plate actuation and pressure sensors to easily collect the power, gap and the other required parameters.
The basic parameters of the four plates used in the experiments are shown in Table 2. All the plates were treated with an abrasive material in a stock suspension before the experiments were conducted to ensure parallelism.
3. Results and Discussion
3.1 Relationship between the CEL and the BI-based characterization parameters
According to the formula of the SEL, SSL, MEL and MSSL and the characterization parameters of them in Table 1, it can be concluded that the last three values are all SEL-based refining intensities, and the characterization parameters for these are all CEL-based. Both the MEL and SEL represent the energy consumption for the unit bar length, resulting in their characterizations and dimensions being similar and their values being proportional for the same patterns of bars and grooves. However, the SSL represents the energy consumed per unit area considering both the bar width and bar edge, meaning that its dimension is different than the SEL and MEL. The BIA and BIL based on the bar interaction point N and bar interaction parallelogram BIP are different from the SEL-based intensities due to the different analysis methods. However, the BI-based intensities are also machine intensities.
The values for N, BIL and BIA are calculated using the data in references 22 and 23, which showed that their values were slightly higher than the results obtained by Elahimehr. From an analysis of the data shown in Fig. 5, we see that the relationship between N2 and N1 calculated by Elahimehr can be expressed by: N2=1.42237N1+0.01888.
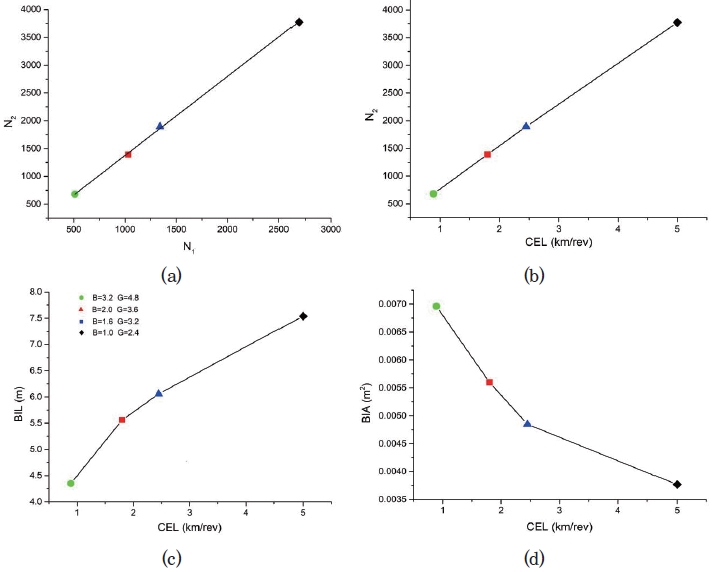
Meanwhile, the bar interaction points N and CEL are positively correlated, indicating that the CEL can better reflect the bar interaction point N. Additionally, the value of BIL increases with CEL, and BIA decreases as CEL increases; however, no obvious proportional relationship is found between these parameters and CEL, meaning that these values are complex and influenced by various parameters, such as the bar width, groove width and bar interaction angle. Therefore, we can assume that the characterization performance of the BI-based refining intensities will be different during the refining process.
3.2 The characterization performance of different refining intensities
Refining is a process that reforms the fiber properties and morphology to achieve specific fibrillation and cutting. The beating degree and average fiber length are employed to analyze changes in the fiber properties, and predictions and characterization performance of the beating degree and the average fiber length are studied considering different intensities, such as the SRE, SEL, SEL-based intensities and BI-based intensities.
Fig. 6 shows that the SRE can predict the beating degree of the pulp well without considering the patterns of bars and grooves used as part of refining; however, a deviation existed when predicting it using SEL-based and BI-based intensities. The trend in the changes in the beating degree predicted by the SEL-based intensities is consistent with the actual measured value but there is a large deviation in the prediction of accurate values. However, the SSL has a better forecasting ability when predicting the beating degree compared with other SEL-based intensities because it considers bar parameters more comprehensive to produce a higher relative accuracy. Considering the bar interactions, the refining intensity based on BIA is consistent with the predictions of the changing beating degree when P/(nBIA)<0.05 kW/m2, and when the measurement and prediction performance of the beating degree for P/(nBIL) and SSL are determined to be similar through a comparison of Fig. 6(b) and Fig. 6(e).
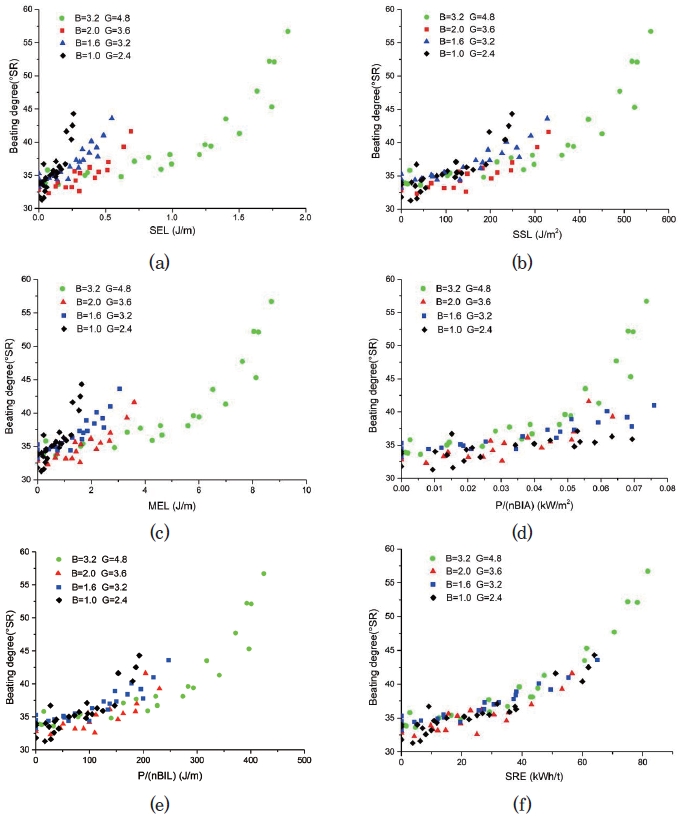
Fig. 6.
The relationship between the refining intensities based on the different characterization parameters and changes in the beating degree of the pulp under constant conditions.
In a comprehensive analysis, the SRE can better measure and predict the change in the beating degree and Pt/(nBIA) can better predict the degree of beating within a certain range. Compared with other SEL-based intensities, the prediction and measurement of P/(nBIL) and SSL is slightly better.
A reasonable characterization of the average fiber length during the refining process is essential for controlling the pulp and its properties. By analyzing the relationship between the refining intensities based on the different characterization parameters and the average fiber length, it can be concluded that the SSL, which was established using a wide variety of parameters and was compared with other SEL-based intensities and the intensity based on the BIL(P/(nBIL)), can better indicate changes in the average fiber length during refining, as shown in Fig. 7. However, P/(nBIA) has a better prediction performance when its value is less than 0.045 kW/m2. The characterization performance of the SRE on fiber average length is similar to that of P/(nBIA), which can predict the average fiber length within a certain range, and a larger deviation will occur if the SRE is beyond a critical value.
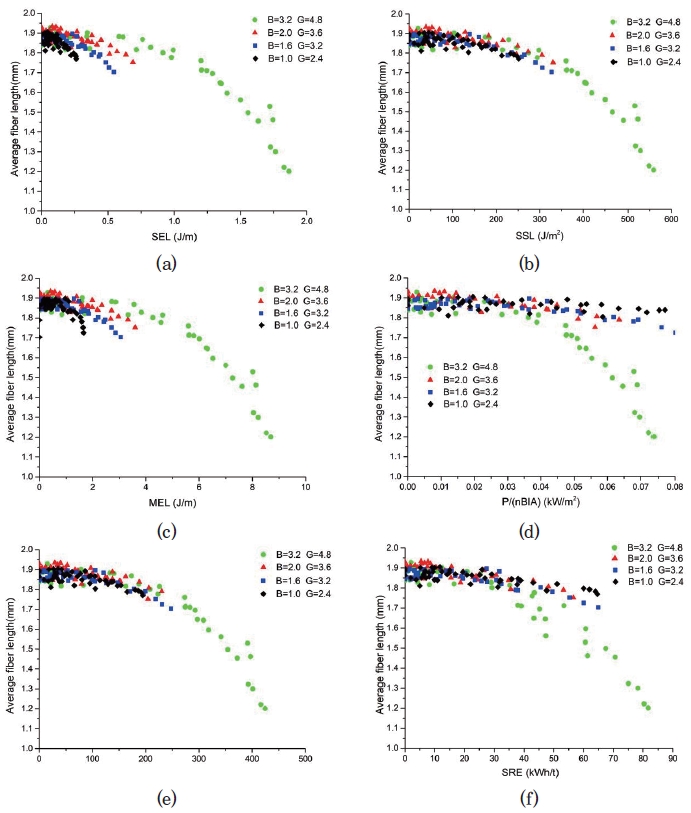
Fig. 7.
The relationship between the refining intensities based on the different characterization parameters and the change in the average fiber length for the same conditions.
It is not difficult to comprehensively conclude that the change in P/(nBIL) and the SSL correlate well with the average fiber length. Meanwhile, P/(nBIA) and the SRE can better characterize the change in the average fiber length when its value is less than the critical value.
The above analysis includes the relationship between various intensities based on the different characterization parameters and the properties of the pulp and fiber and the relationship between the CEL and the characterization parameters based on the bar interactions. However, there are a variety of parameters describing the fiber and pulp properties that need to be characterized in addition to the beating degree and average fiber length. The intensities mentioned above cannot be used to characterize all the properties of the fiber and pulp, meaning further studies are needed to better understand the refining intensity.
4. Conclusions
In this paper, the characterization parameters associated with refining intensities were studied by considering the CEL and bar interactions. Based on previous studies, the BSA was used as the effective refining area instead of the entire disc area. Two characterization parameters based on bar interactions, BIL and BIA, were calculated by defining a bar interaction parallelogram. The intensities based on BIA and BIL were established and computed using experimental data from previous studies. The following conclusions can be drawn from the data analysis:
(1) The SEL-based refining intensities and BI-based intensities, both of which consider the patterns of bars and grooves and their individual natures are slightly different. The value of the CEL can directly reflect the number of bar interaction points N, but do not describe the changes in BIA and BIL, where the CEL is only related to the bar length and bar angle. Additionally, the two characterization parameters based on bar interactions are complicated by the influence of many other parameters, such as bar width, groove width and bar angle.
(2) The SRE is the best indicator when measuring changes in beating degree or freeness during refining, and the SSL can predict these properties slightly better than other SEL-based intensities, such as the SEL and MEL. Meanwhile, the characterization performance of P/(nBIA) is better than that of P/(nBIL), but it can only partially reflect the changes in the beating degree.
(3) The SSL and P/(nBIL) are superior for predicting the average fiber length and can accurately measure the changes in the fiber length before and after refining. However, the SRE and P/(nBIA) can only predict the fiber length within a certain range, which is better than the SEL and MEL, which cannot measure fiber length very well.
(4) The SSL, SRE, P/(nBIA), and P/(nBIL) have their advantages and disadvantages and are not precise and comprehensive refining intensities. Meanwhile, CEL(Bs+Br)/[2cos(r/2)], BIA and BIL are also not optimal characterization parameters for describing the refining process.