

1. Introduction
2. Refining Theory
2.1 Power consumption and efficiency
2.2 Specific Edge Load (SEL) theory
2.3 Specific Surface Load (SSL) theory
2.4 Other refining theories
3. Low-Intensity and High-Intensity Refining
3.1 Understanding refining intensity
3.2 Refiner plates and their link to refining intensity
3.3 Ultra low-intensity plates (fine bar/ultra-fine bar)
4. Operation of Refining Systems
4.1 Overview of refining systems
4.2 Refining systems for multiply paperboard
4.3 Series and parallel refiner configurations
4.4 Refining variables
5. Integrated Advances and Grade-Specific Strategies
6. Conclusions and Future Directions
1. Introduction
Papermaking professionals increasingly confront an energy–quality trade-off (often described as a paradox): improving bonding-controlled properties through refining can coincide with higher drainage resistance, longer drying times, and increased energy use. In Part I, we established the fundamental mechanisms of pulp refining and reviewed the evolution from Hollander beaters to modern disc and conical refiners, alongside advances in refiner plate technology (vertical-bar geometries, specialized metallurgy) [1,2,3,4]. To ground performance discussions in measurement practice, we reference standard drainability methods widely used to assess refining outcomes [5,6]. Foundational studies on fiber development and bonding further explain how mechanical treatment transforms rigid wood fibers into flexible, bondable elements suitable for paper and paperboard [2,4,7,8,9].
Despite these technological advances, mill-scale optimization remains challenging because the trade-off involves competing effects that equipment choice alone cannot resolve. Increasing refining energy improves tensile and burst strength, as well as surface smoothness, yet simultaneously raises drainage resistance, prolongs drying time, increases specific energy consumption, and can reduce bulk and tear strength [8,9,10]. Recent plate developments—including lightweight fine-bar and vertical-bar designs—target efficiency and fiber quality in mill conditions but require quantitative guidance to translate plate features into predictable fiber modification [11,12,13,14,15]. This review was written to bridge that gap by integrating theory, operation, and digital control into a coherent framework that predicts and manages the energy–quality trade-off in everyday refining decisions.
We first articulate intensity descriptors grounded in bar geometry and operating conditions, focusing on bar width, bar–groove ratios, and consistency, because these define the forces at the fiber–bar interface [16,17,18,19]. Building on this physical basis, we formalize intensity using the Specific Edge Load (SEL) concept and refiner characterization methods to link applied power, bar crossings, and speed to fiber-level modification [20,21,22,23].
Within this framework, choosing intensity becomes a central lever. Industrial and experimental evidence consistently show that low-intensity refining with ultra-fine bar patterns can deliver superior fiber development at lower net energy. Adjusting SEL across typical operating ranges produces distinct fiber morphologies, bonding potentials, and strength responses [24,25,26,27,28]. Grade-level design research, which relates process parameters to through-thickness properties, underscores the need to translate theory into grade-specific protocols rather than one-size-fits-all settings [29,30,31,32].
Beyond intensity, outcomes depend on interacting variables—stock consistency, pH, temperature, throughput, fiber coarseness, and bar-crossing geometry—that govern swelling, flexibility, and stress transfer during refining. Strategies must also reflect fiber type: softwood chemical pulps, hardwood pulps, and recycled fibers respond differently and demand tailored energy distribution and plate geometry [33,34,35,36].
Advances in smart refining integrate real-time sensors, advanced control, predictive analytics, and digital twins, enabling mill teams to manage fiber quality, energy consumption, and equipment protection as a unified optimization problem [37,38,39,40,41,42,43]. This review situates refining within broader sustainability and life-cycle perspectives and process dynamics, drawing on current industry views across grades—including tissue and specialty papers—to frame the direction of low-consistency refining [44,45,46,47,48,49,50,51,52,53,54,55,56,57,58,59,60,61,62,63,64].
By unifying intensity theory, plate design, operational variables, and digital control—and converting these into grade-specific protocols, this review provides a practical, decision-ready framework for mills seeking sustainable, energy-efficient production of high-quality papers and boards. The scope includes printing & writing, packaging (kraft liner and corrugated), tissue/towel, specialty grades (e.g., glassine, separators), and multi-ply boards, with guidance designed for routine mill optimization and capital/plate selection planning.
2. Refining Theory
2.1 Power consumption and efficiency
Refining is the central process for tailoring the physical properties of pulp fibers to meet final paper quality requirements. The outcome of refining is influenced by a complex interplay of variables, including wood species (softwood vs. hardwood), bleaching status, stock consistency, flow rate, and refiner plate geometry [2,3,4]. Mathematically, refining has been quantified since 1887, evolving into modern theories that apply regardless of the type of refiner (disc or conical) [34].
In low-consistency refining, total power consumption is categorized into:
• Total Power (Ptot): Total electricity supplied to the refiner motor.
• No-Load Power (Pi): Power required to rotate the refiner components in the stock without performing actual fiber treatment. It typically accounts for 15–50% of the total energy, depending on the refiner state and plate design [5,6,34]. Physically, Pi encompasses mechanical losses (bearing friction), hydraulic losses (pumping effect and circulation load), and idling losses. While some studies define it by running the refiner with water and open gaps, in actual mill practice, it is more accurately defined as the idle power measured with stock flowing under normal process conditions while the plates are backed off sufficiently to avoid any measurable impact on fiber morphology [3,12].
• Net Power (Pnet): The actual energy transferred to the fibers (= Ptot - Pi).
No-load power increases exponentially with plate diameter (D, inch) and rotational speed (rpm) of the disk refiners, as shown in Eq. (1)[3]:
For conical refiners, the corresponding scaling differs due to the distinct flow field and hydraulic behavior in the conical refining zone; therefore, geometry-dependent correlations should be used when available from the referenced sources [3,34].
From an operational standpoint, minimizing no-load power is critical for refining energy efficiency. For instance, increasing the plate diameter from 20 to 22 inches increases no-load power by ~50%, while worn plates consume ~30% more energy than new ones [31,32]. Thus, optimizing speed/diameter and timely plate replacement are essential to reduce idle power and boost process efficiency.
2.2 Specific Edge Load (SEL) theory
Developed by Wultsch, Flucher, Brecht, and Siewert, the SEL theory distinguishes between the amount of refining and the intensity of the impact [3,4,8,7,13,17]. The SEL theory is based on the fundamental assumption that the refining action primarily occurs along the line where the bar edges intersect.
• Specific Refining Energy (SRE) measures the net energy applied per ton of fiber (kWh/t), calculated as:
where, F is the volumetric flow rate and C is the stock consistency; their product (F × C) represents the mass flow rate of the pulp, typically expressed in bone-dry metric tons per hour (bdmt/h).
• SEL (W·s/m, J/m) defines how “hard” the fibers are hit at the bar edges. It is the net power divided by the Cutting Edge Length (CEL) per second:
where, CLF is the Cutting Length Factor, n is revolutions per second, Nr and Nst are the number of bars on the rotor and stator plates, and L is the common contact length between the rotor and stator bars (km). For calculation purposes, Pnet is taken in kW and CEL in km/s to yield the standard unit of J/m.
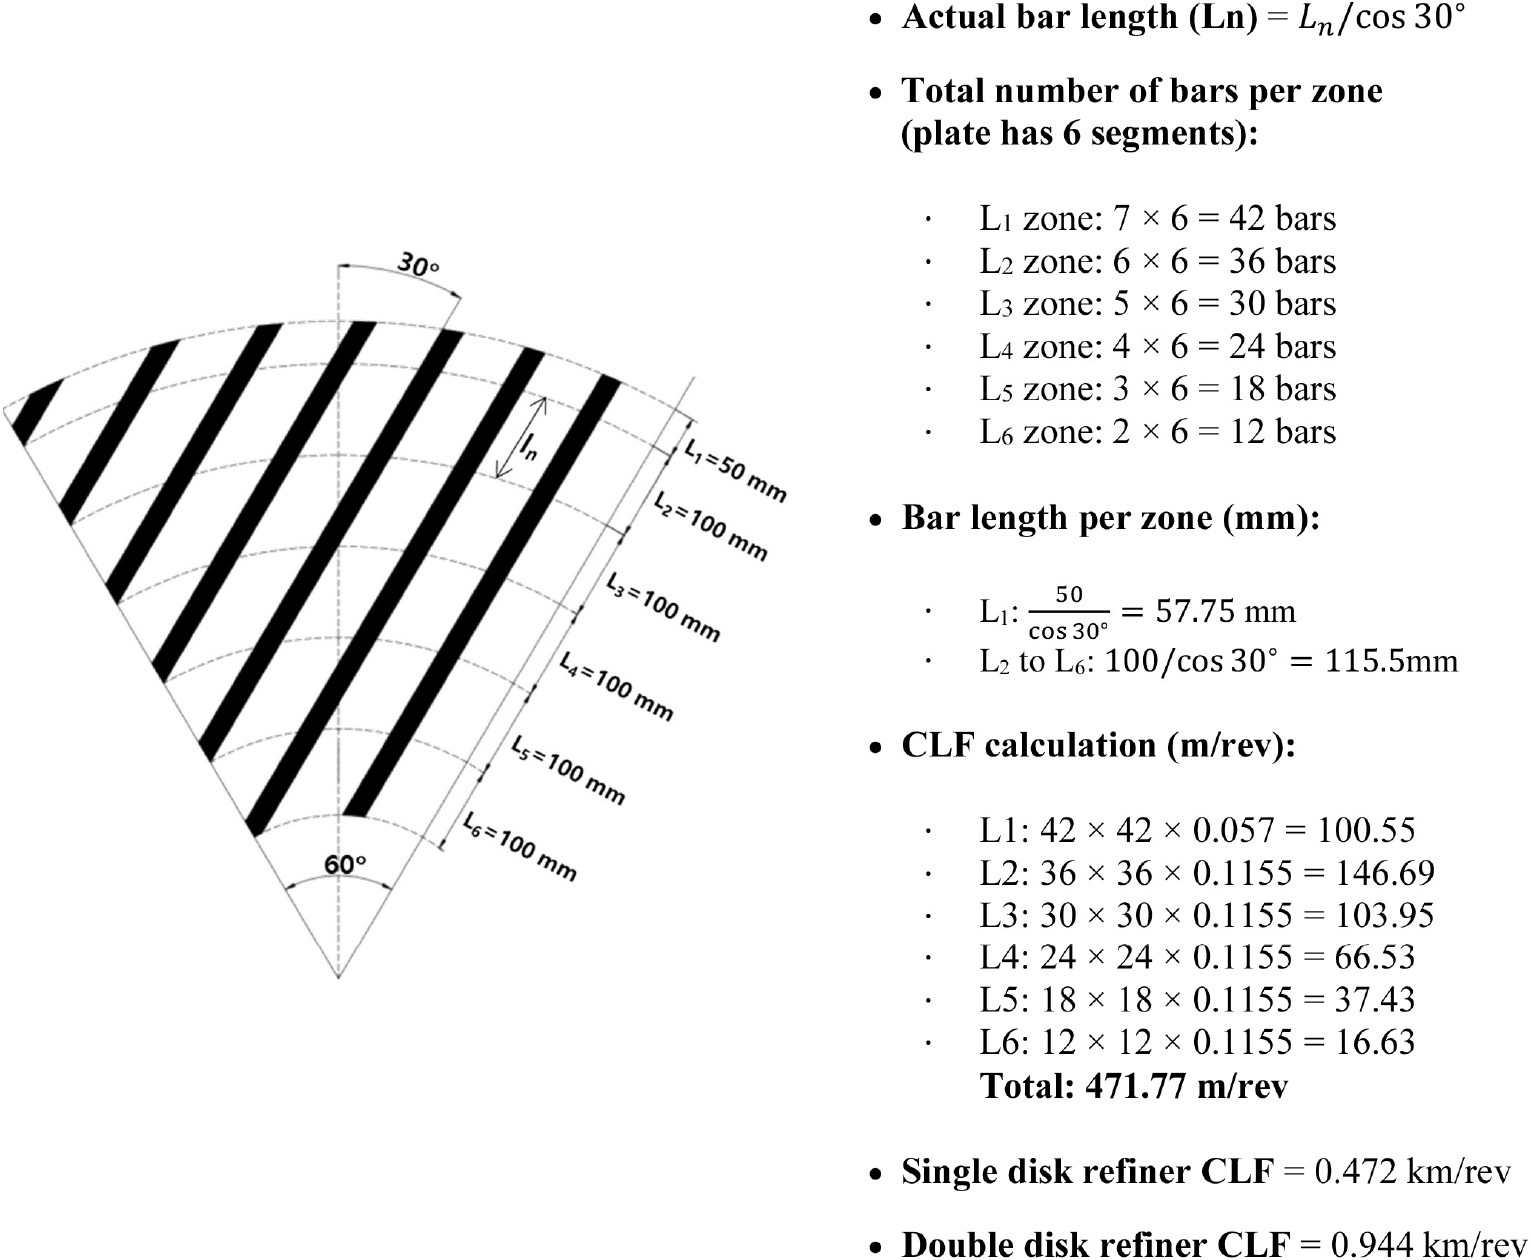
CLF is a fundamental metric used to quantify the refining capacity of a specific plate design, representing the total length of bar edges that cross each other per revolution. As illustrated in Fig. 1, the CLF is calculated by analyzing the plate’s geometry across various radial zones, accounting for the number of bars per zone and the effective bar length adjusted by the bar angle.
CLF is a primary determinant of refining intensity, which governs the physical transformation of fibers [4]:
• Low intensity (fine bar pattern): A high CLF, resulting from a high density of bars, leads to a lower SEL. This “soft” refining approach is ideal for short-fibered hardwood or recycled pulp, as it focuses on surface treatment while preventing excessive fiber shortening.
• High intensity (coarse bar pattern): Conversely, a low CLF indicates fewer, coarser bars, resulting in a higher SEL. This “hard” refining is necessary for long, thick-walled softwood fibers. While the primary objective is to promote internal fibrillation and flexibility, the higher intensity provided by a lower CLF is also strategically employed to achieve necessary fiber shortening, which is often required to optimize sheet formation and structural uniformity in softwood grades.
In summary, the CLF serves as a critical design and operational parameter, allowing papermakers to balance the competing requirements of fibrillation and shortening to match the morphological characteristics of the raw material.
While the SEL theory provides a simple and intuitive method for quantifying refining intensity, it has inherent limitations. Because the calculation relies solely on total bar edge length and rotational speed, it fails to account for several critical variables that dictate actual refining outcomes [1,4,15]. It does not consider the net energy per pass or the residence time fibers remain in the refining zone [4,32]. Furthermore, unlike SRE, SEL ignores stock conditions such as consistency and flow rate; higher consistency increases fiber-to-fiber interactions, dispersing the impact, while lower consistency intensifies the impact on individual fibers [4,37]. Plate geometry is also overlooked, specifically how bar and groove widths influence energy—wider bars disperse energy while narrower bars focus it [9,10,17,35]. Additionally, SEL does not reflect fiber dynamics, such as the non-uniform impact from fiber stapling at bar edges, nor the plate gap, where a narrower clearance enhances compression and cutting [14,32]. Finally, the overall bar pattern design, including arrangement and crossing angles, significantly affects fiber treatment but is not captured by this theory [4,17,37].
Despite these shortcomings, SEL remains the most widely used metric in the industry. Its strength lies in its mathematical simplicity and the accessibility of required data (e.g., bar counts, RPM, and net power). For mill operators, it serves as a reliable empirical benchmark for establishing operational ranges for specific pulp types.
In conclusion, while SEL is a valuable primary indicator for refining intensity, it is not an absolute predictor of quality. For a more comprehensive evaluation, SEL should be used in conjunction with other metrics, such as SSL and SRE, to capture the overall interactions among stock properties, plate design, and operational variables.
2.3 Specific Surface Load (SSL) theory
The SSL theory, proposed by Lumiainen (1990), was developed to address the limitations of the SEL theory by incorporating the effect of bar width [4,37]. While SEL only considers the length of the bar edges, SSL quantifies the energy density applied to the bar surface, providing a more accurate measure of the actual impact intensity on fibers [15,37].
The SRE can be expressed as a product of the number of impacts (N), the impact intensity (SSL), and the impact length factor (W) [4,37]:
• Impact Length (W): This represents the effective width over which the refining impact occurs. As shown in Fig. 2, W is determined by the bar widths of the rotor (Wr) and stator (Wst) and the average crossing angle (θ):
A smaller crossing angle results in a shorter W, thereby concentrating the pressure on the fibers.
• Specific Surface Load (SSL): Calculated by dividing SEL by the impact length (W), expressed in J/m2:
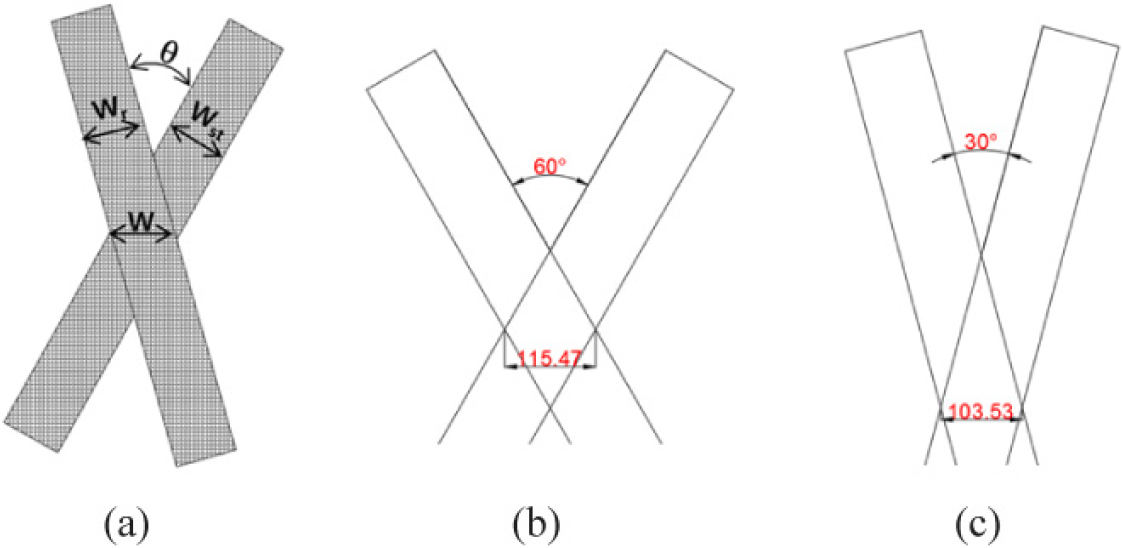
This formula demonstrates that even with an identical SEL, a narrower bar results in a higher SSL (higher intensity), while a wider bar results in a lower SSL (lower intensity).
• Number of Impacts (N): This defines the total number of impacts a fiber mass (M) receives while passing through the system, calculated by dividing the cutting speed (Ls) by the mass flow rate.
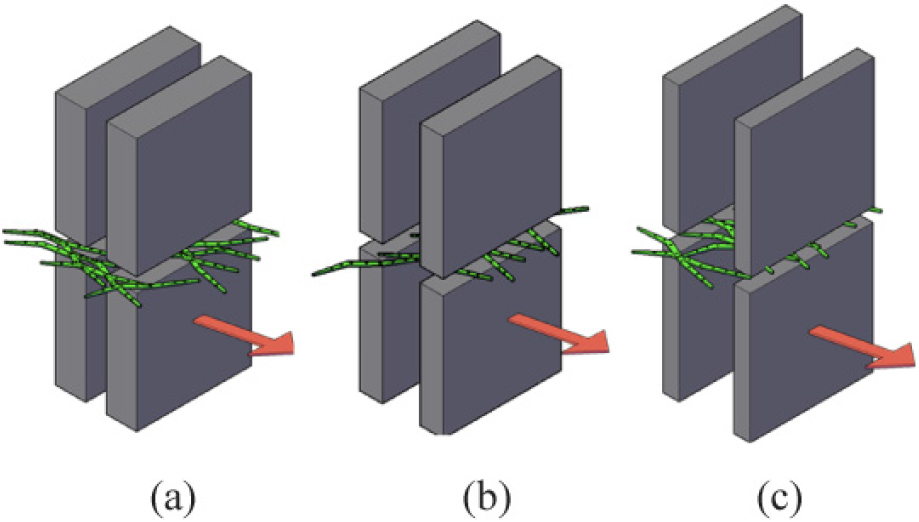
Fig. 3 illustrates three different plate patterns that all share the same SEL (3.7 W·s/m). Despite having the same SEL, their SSL values differ significantly (440, 704, and 1,210 J/m2) due to variations in bar widths [4,37].
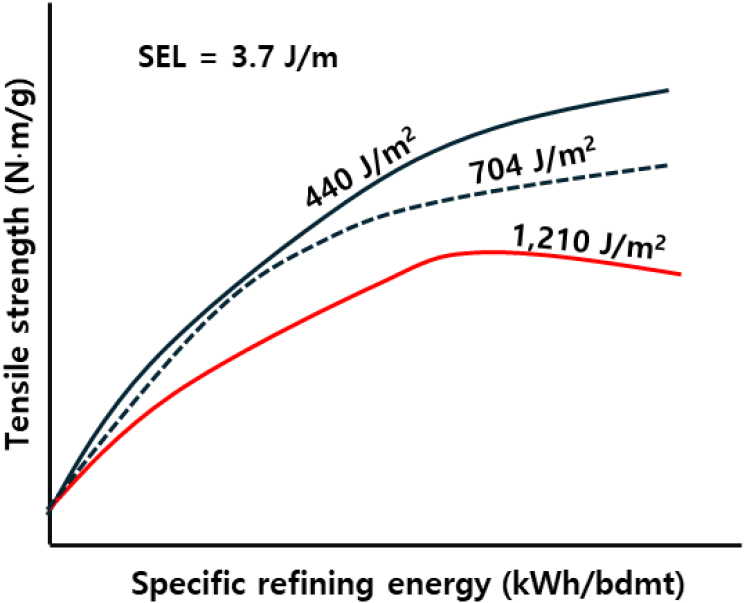
The practical effect of these differences is shown in Fig. 4:
• Low SSL (440 J/m2): Wider bars distribute energy more uniformly. This results in rapid development of tensile strength with minimal fiber damage.
• High SSL (1,210 J/m2): Narrower bars concentrate energy, increasing the risk of fiber cutting and leading to slower strength development.
The choice between these theories depends on plate geometry and fiber-bar interactions. While SSL is effective for fine bar patterns, SEL is a superior analytical framework for coarse patterns where bar width exceeds fiber floc length. In such cases, refining is governed by a bar-edge-driven mechanism: as flocs spread across wider bar surfaces, instantaneous pressure is reduced, and primary fiber transformation occurs at the bar edges. Consequently, focusing on the number of edge crossings and the force per edge (SEL) provides a more accurate prediction of outcomes. This approach explains how these conditions minimize excessive cutting, enhance fiber flexibility, and better preserve paper strength [6,38]. For optimal control, a comprehensive approach integrating both metrics is recommended [4,19,26,37].
2.4 Other refining theories
While SEL and SSL are the most widely recognized concepts for describing refining intensity, other approaches have been proposed to better capture the complexity of refining phenomena. Two notable examples are Danforth’s impact-based theory and Kerekes’ C-factor analysis.
2.4.1 Danforth’s impact-based theory
In the late 1960s, Danforth introduced a model that explains refining as a function of two independent variables [18]:
• Number of impacts (N) experienced by fibers during passage through the refiner
• Impact strength (S) resulting from bar–fiber interactions.
This approach considers refining as a combination of impact frequency and intensity, rather than simply energy input. Impact frequency is influenced by factors such as rotational speed, bar count, and stock flow, while impact strength depends on plate gap, bar pattern, and net refining energy [4,19]. Thus, the model offers a more physical interpretation of refining mechanisms.
However, Danforth’s theory is rarely applied in mill operations due to its complexity. Quantifying impact strength requires precise measurement of fiber–bar interactions, which is challenging under continuous industrial conditions. Despite these limitations, the theory provides an important conceptual foundation for understanding refining beyond energy-based metrics.
2.4.2 Kerekes’ C-factor analysis
In 1990, Kerekes proposed the C-factor as an extension of SEL and SSL concepts [4,15,19,20,21]. This method incorporates not only bar geometry and operating speed, but also fiber characteristics such as length and surface roughness, offering a more comprehensive framework for predicting refining outcomes.
The rationale is that refining efficiency depends on both impact conditions and fiber properties. For example, longer or rougher fibers have larger contact areas with bars, altering the way energy is transmitted. Consequently, two systems operating at identical SEL or SSL may produce different results depending on fiber morphology. The C-factor attempts to quantify these differences.
Although scientifically robust, the C-factor is seldom used in routine mill control because [19,20]:
• Fiber properties (length, roughness) are difficult to measure accurately in real time
• Calculations are complex, and plate wear or operating changes significantly affect the factor.
As a result, C-factor analysis is primarily applied in research, refiner design, and advanced process optimization, rather than in daily operations.
Both Danforth’s and Kerekes’ theories provide deeper insights into refining mechanics compared to SEL or SSL. Danforth emphasizes the frequency and strength of impact, while Kerekes integrates fiber characteristics into the analysis. However, due to measurement challenges and computational complexity, these models are not widely adopted in mill practice. Instead, they serve as valuable tools for refiner development, plate design, and high-level optimization [4,15].
3. Low-Intensity and High-Intensity Refining
3.1 Understanding refining intensity
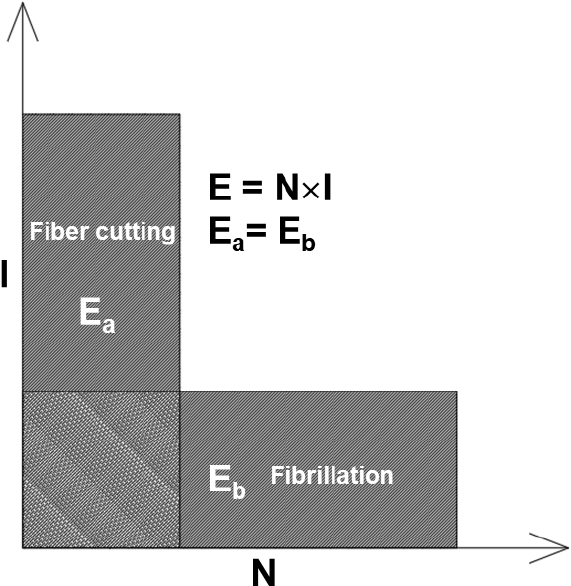
In papermaking, the total energy consumed in refining is governed by two core variables [1,3,4,7,13,15]:
• Number of impacts (N): how many times fibers are impacted during passage through the refiner
• Impact intensity (I): how strong each impact is on the fibers (i.e., the energy delivered per impact)
These combine to give the total SRE per unit fiber mass:
This fundamental relationship reveals two distinct refining strategies with dramatically different outcomes:
• Low-intensity approach (high N, low I): - Many low-energy impacts promote internal and external fibrillation - Fibers develop bonding potential with minimal cutting - Result: Higher tensile strength, better formation, improved surface properties
• High-intensity approach (low N, high I): - Few high-energy impacts tend to cut fibers - Excessive fiber shortening and fines generation - Result: Lower tear strength, potential bulk loss, drainage problems
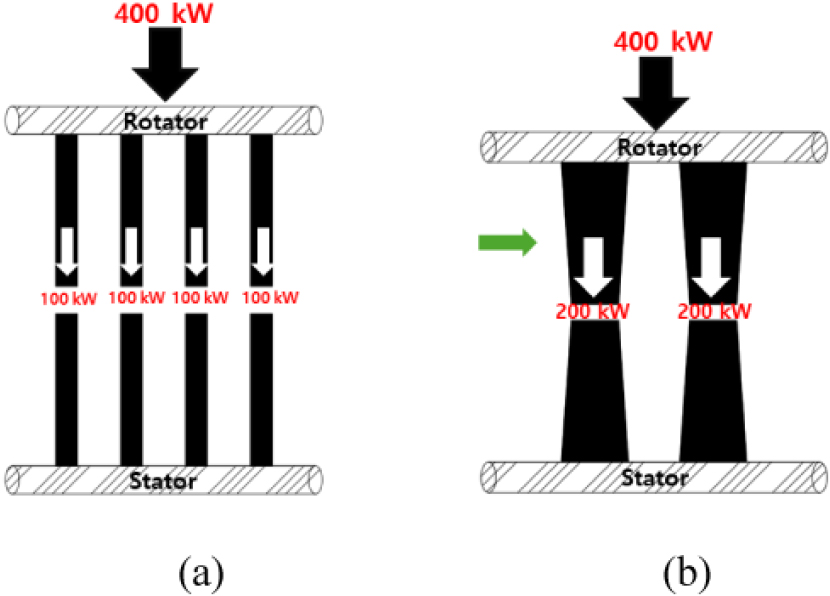
Fig. 5 illustrates this fundamental distinction. For equivalent total energy input, path (a) achieves superior fiber development through numerous gentle impacts, while path (b) causes excessive fiber damage through fewer but more violent impacts.
3.2 Refiner plates and their link to refining intensity
The configuration of refiner plates plays a crucial role in determining refining intensity, which must be carefully calibrated according to the specific pulp type and the desired final properties of the paper [3,10,11,12,18,25,27]. A direct, quantifiable link exists between the physical plate design and the resulting intensity, a relationship typically measured by the SEL [4,8,12,24].
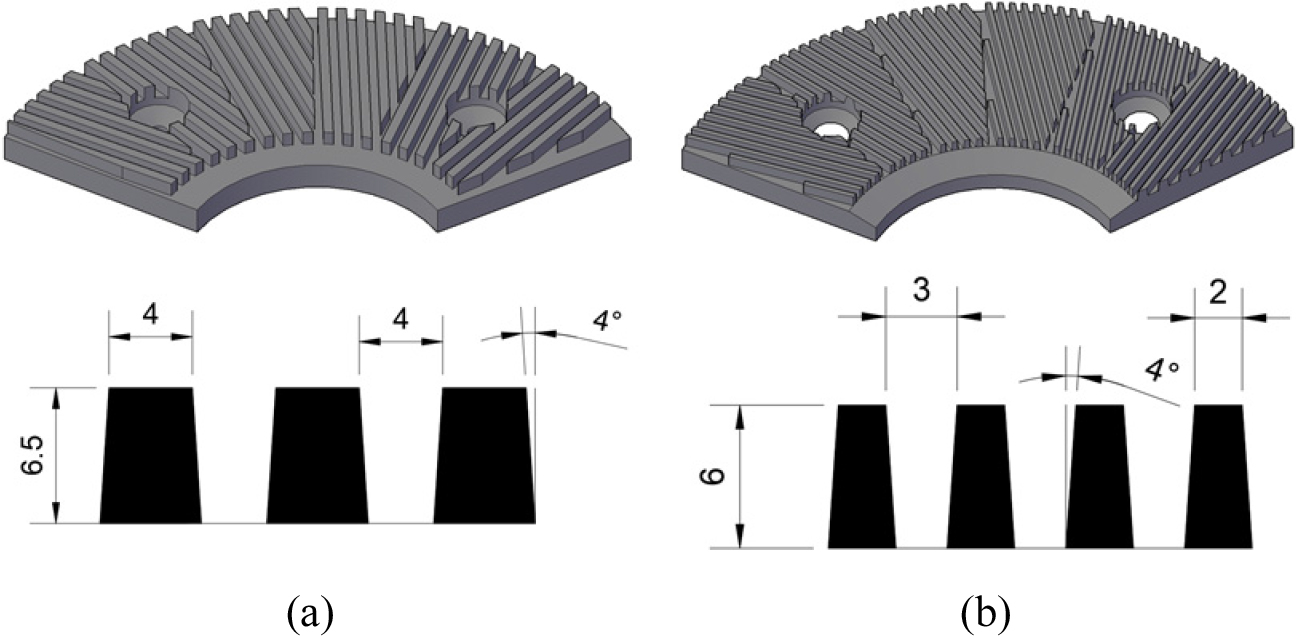
Traditionally, different plate patterns have been used to achieve specific outcomes, as shown in Fig. 6[4,13,18,25,27]:
• Softwood refining: Plates generally feature wider bars (3–5 mm) and operate at higher intensities, with an SEL of 1.5–2.0 W·s/m, resulting in moderate fiber cutting, ideal for initial fiber opening.
• Hardwood refining: These plates utilize narrower bars (2–3 mm) and a lower intensity (SEL of 0.6–1.0 W·s/m) to achieve a balance between fibrillation and fiber cutting.
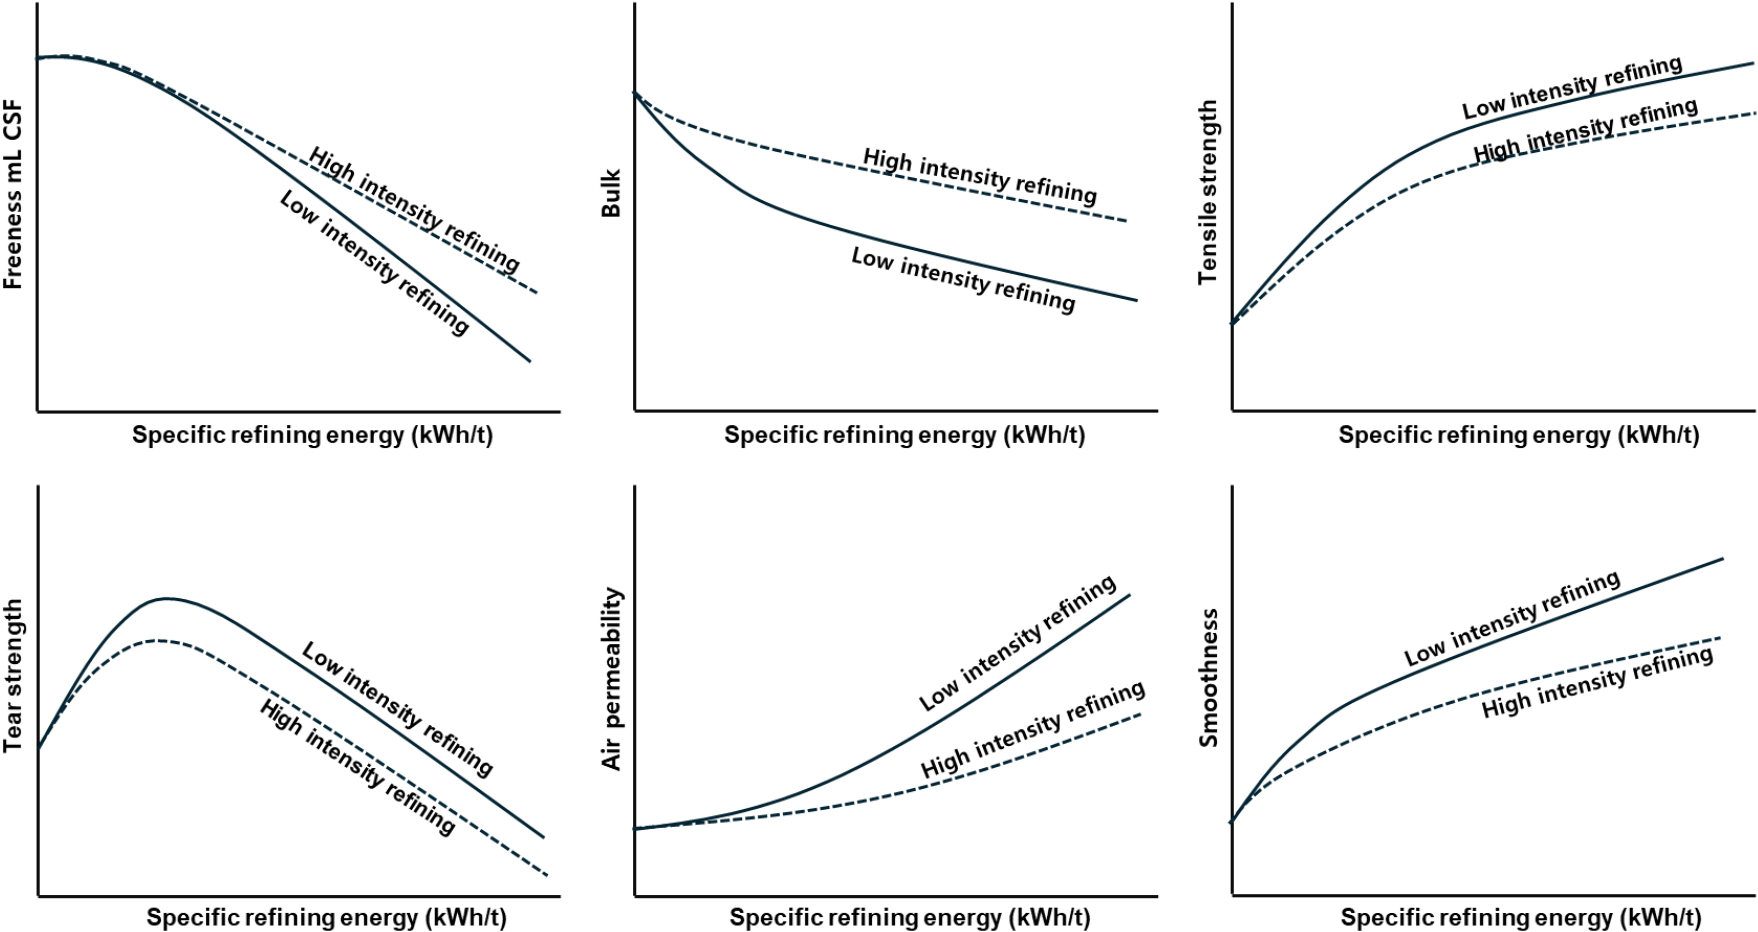
Despite these long-standing standards, research over the last 20 years has challenged the need for such high intensities. It has been found that reducing the intensity while maintaining the same total energy input—primarily by increasing the frequency of fiber impacts—results in significantly improved fiber quality [1,4,21,22,24].
Refining intensity plays a critical role in pulp processing. If long, softwood fibers are refined too gently, fibrillation may be inadequate, resulting in reduced bonding and tensile strength [1,3,4,12]. In contrast, excessively high intensity can cause overcutting, fiber shortening, increased fines, impaired drainage, and lower strength [16,37]. As shown in Fig. 7, low-intensity refining generally provides better tensile strength and surface properties, whereas high-intensity refining accelerates the loss of strength and tear resistance at higher energy levels [3,4,5,7,8,11,12,13,16,24,26,37].
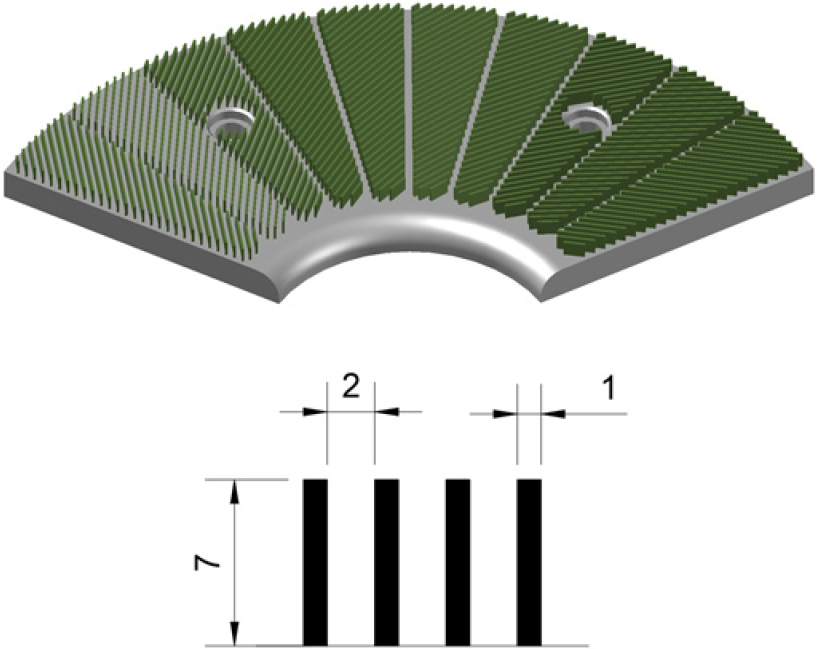
3.3 Ultra low-intensity plates (fine bar/ultra-fine bar)
Ultra-low-intensity plate technology represents a significant advancement in refining strategy, shifting from concentrated impacts to distributed energy application [3,10,11,12,13,24,27]. As shown in Fig. 8, these plates feature extremely fine bar patterns with widths of 0.8–1.2 mm and groove depths of 6–9 mm, combined with optimized bar crossing angles of 30–40°. This configuration enables a dramatic reduction in SEL to approximately 0.1–0.5 W·s/m—far below the conventional range of 1.5–2.0 W·s/m—favoring fibrillation over fiber cutting [9,10,11].
The energy distribution concept illustrated in Fig. 9 highlights the difference between high-intensity and ultra-low-intensity refining: the latter uses numerous fine bars to spread energy across many gentle impacts (Fig. 9a), rather than concentrating it on fewer bars (Fig. 9b) [3,12]. This approach delivers multiple performance benefits. At equivalent freeness levels, fibers refined with ultra-low-intensity plates exhibit 5–10% higher tensile strength and 15–20% greater burst strength, along with improved surface smoothness, better formation, and minimal fiber shortening, thereby preserving tear strength. SRE is reduced by 10–15%, complemented by lower no-load power due to optimized flow dynamics and reduced downstream drying demands resulting from favorable drainage characteristics [3,4,8,10,11,12,23,26,27,33,64].
Equipment longevity also improves significantly. Vertical bar configurations minimize wear and extend plate life by 30–50%, reducing maintenance intervals and overall ownership costs. Operationally, these plates provide a wider performance window, lower sensitivity to fluctuations in stock consistency, and reduced risk of plate clashing, thereby enhancing mill stability [5,6,12,23,26].
Application guidelines recommend ultra-low-intensity plates for hardwood chemical pulps (0.8–1.0 mm bars), secondary refining of softwood pulps (1.0–1.2 mm bars), and recycled furnish materials such as OCC and ONP, where fiber preservation is critical [4,12,48]. They are less suitable for the primary treatment of coarse mechanical pulps, such as TMP or CTMP [13,21,24]. From an economic perspective, the benefits are compelling: for a 300 ton/day printing paper mill, these plates can save approximately 15 kWh/ton in energy ($164,000/year at $0.10/kWh), reduce plate costs by $40,000/year, and generate up to $600,000/year in quality premiums—totaling around $800,000 in annual value [3,7,13].
Consequently, ultra-low-intensity plates have become essential for producing high-strength printing papers, specialty grades, and premium packaging that require simultaneous optimization of strength and bulk [10,11,12,27,28,29,30,47,52,53,54,55].
4. Operation of Refining Systems
4.1 Overview of refining systems
Modern paper mills employ different refining system configurations based on furnish composition and product requirements. Refining systems are generally categorized into three types: separate refining, mixed refining, and compromise refining [4].
4.1.1 Separate refining
In separate refining systems, individual fiber types—such as softwood, hardwood, or recycled fibers—are processed independently in dedicated refiner lines prior to blending (Fig. 10). This configuration provides maximum flexibility for customizing refining intensity for each component. Softwood requires high-intensity refining to achieve internal fibrillation through controlled cutting, whereas hardwood requires low-intensity refining to minimize fiber shortening [31,37]. As illustrated in Fig. 10, auxiliary units such as deflakers and tickle refiners are integrated to ensure final stock quality. A deflaker is specifically designed to disperse fiber bundles or “flakes”—common in recycled fiber or broke streams—without significantly altering the freeness or individual fiber morphology [4,31]. In contrast, a tickle refiner (or “control refiner”) is positioned just before the paper machine to perform a final, light treatment that stabilizes freeness and fine-tunes the drainage properties of the blended stock [3,12]. Managing the freeness of each stream independently allows for the optimization of specific pulp properties for the final product.
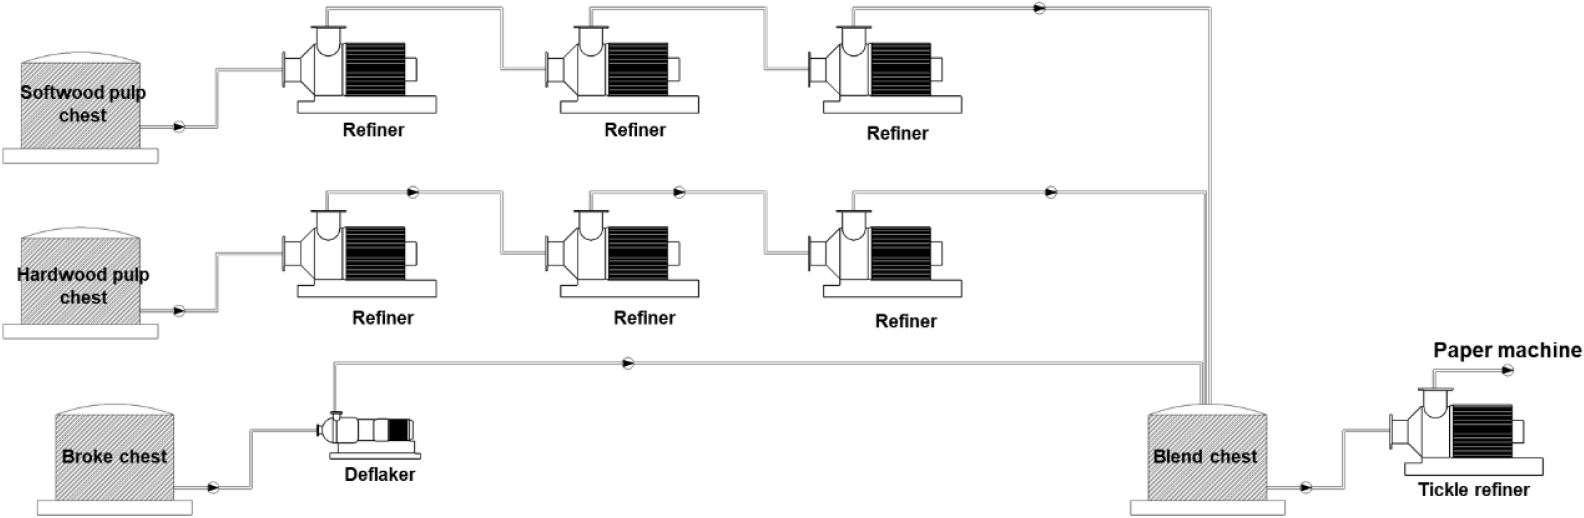
Advantages include precise treatment for each fiber type and superior control of strength and formation, making this approach suitable for high-grade printing papers and multi-grade mills. However, disadvantages include higher capital investment, increased process complexity, and greater floor space requirements [4,31].
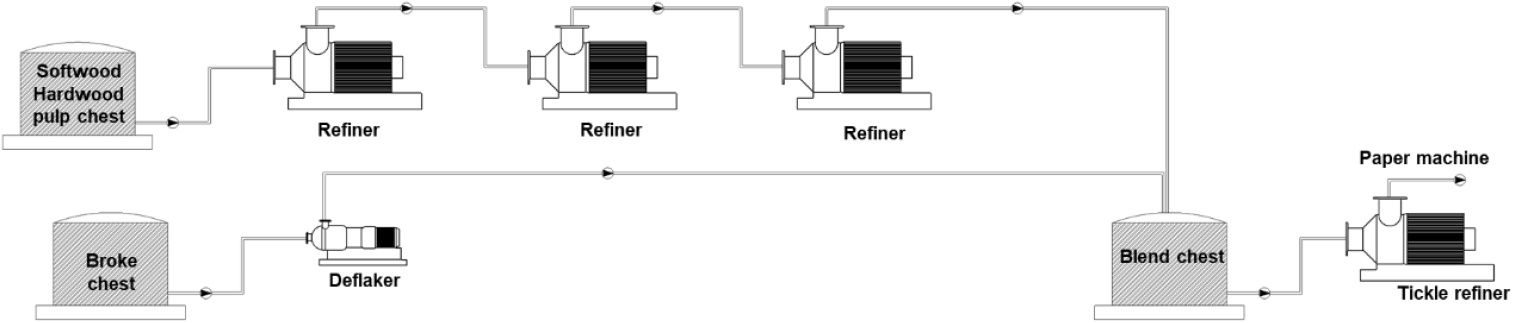
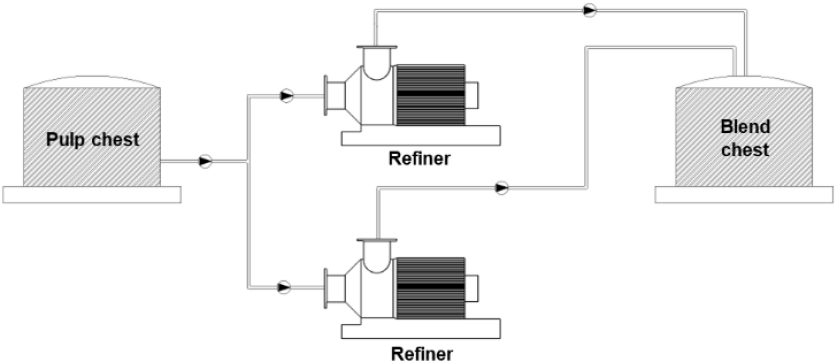
4.1.2 Mixed refining
Mixed refining involves blending all pulp components before refining, treating the entire furnish in a single refiner system (Fig. 11). This approach reduces capital cost and simplifies operation and control. A notable benefit is the “buffering effect,” in which long, softwood fibers protect shorter hardwood or recycled fibers from excessive cutting. However, compromise conditions may not be optimal for any single component, limiting flexibility for grade changes and risking under-refining of softwood or over-refining of hardwood. Mixed refining is commonly applied to tissue, towel, and packaging grades with stable furnish composition, particularly in small- to medium-sized mills [4,26].
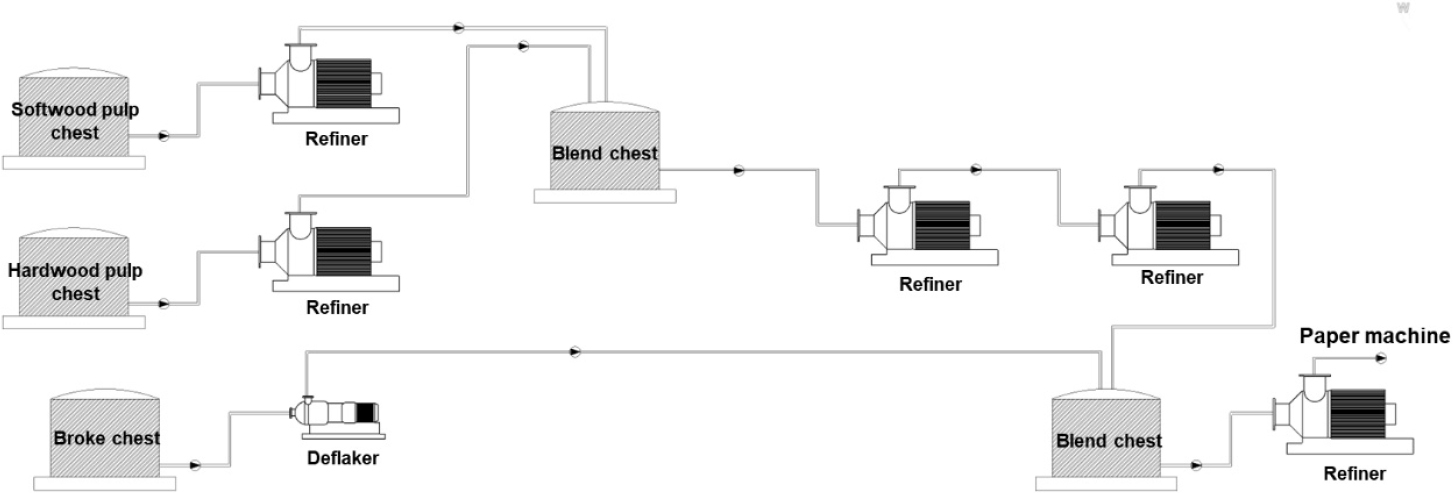
4.1.3 Compromise refining
Compromise refining combines elements of both strategies: primary refining is performed separately at low intensity, followed by secondary mixed refining (Fig. 12). A typical configuration includes Stage 1 separate low-intensity refiners (SRE 20–40 kWh/t) and Stage 2 mixed secondary refining (SRE 40–80 kWh/t), followed by final blending and consistency adjustment [4]. This approach strikes a balance between flexibility and cost, allowing for initial fiber opening without excessive damage while enabling final property adjustment during the mixed stage. It is suitable for multi-grade mills requiring moderate flexibility or operations transitioning from separate to mixed systems [35].
4.2 Refining systems for multiply paperboard
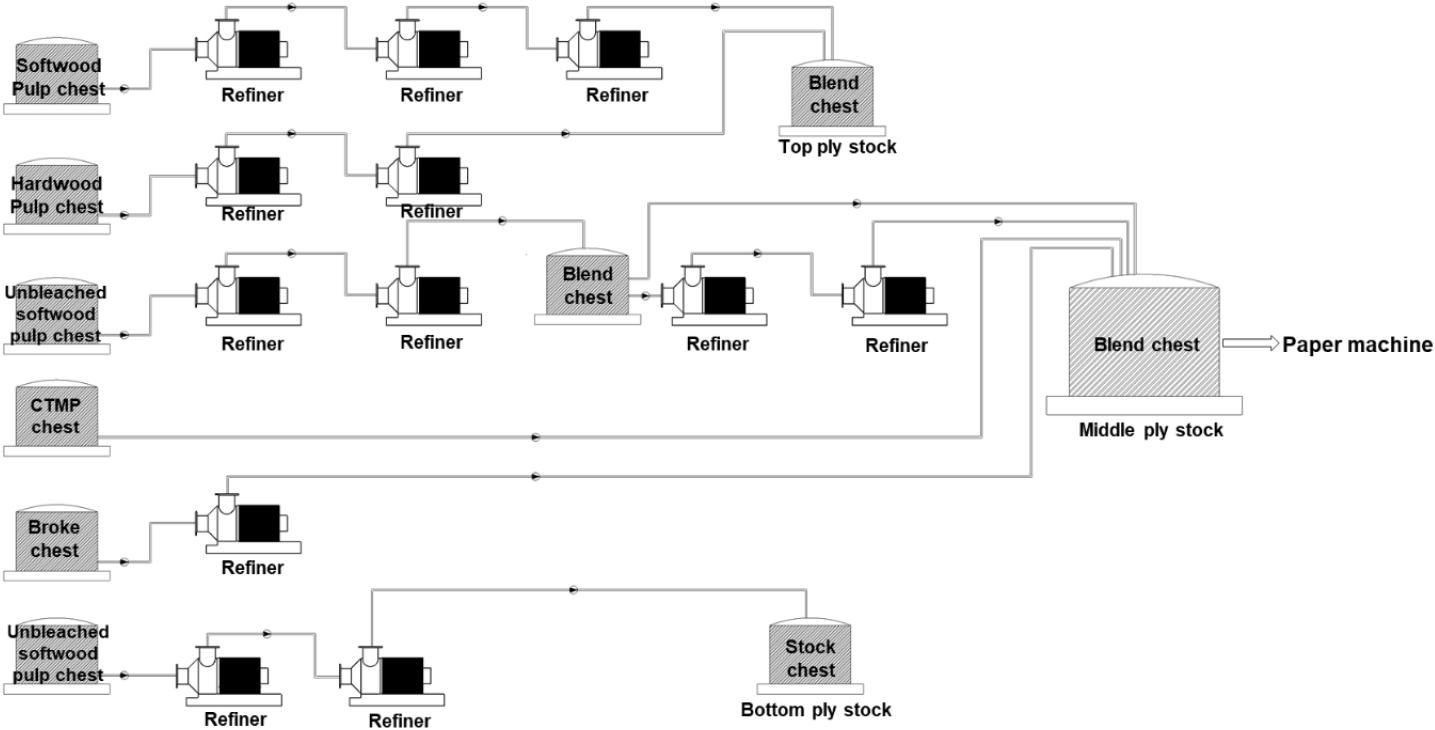
Multi-ply paperboard production demands specialized refining strategies for each ply to optimize overall performance while minimizing energy consumption [28,30]. As shown in Fig. 13, the top ply (surface layer) requires smoothness and printability, typically achieved by refining bleached hardwood kraft or bright recycled fibers at low intensity (SRE 40–80 kWh/t, SEL 0.4–0.8 W·s/m, bar crossing angle 30–40°). The filler ply (middle layers) prioritizes bulk and cushioning, utilizing low-grade recycled or mechanical pulp with minimal refining (SRE 20–40 kWh/t, SEL 0.2–0.4 W·s/m). The bottom ply (backing layer) requires strength and stiffness, necessitating moderate-intensity refining of unbleached kraft or strong recycled fibers (SRE 80–140 kWh/t, SEL 1.0–1.5 W·s/m, bar crossing angle 20–30°) [4,27,28,29,30]. This stratified approach ensures each layer contributes optimally to board properties while controlling total energy input [4,27,28,29,30,55].
4.3 Series and parallel refiner configurations
Refining systems can be arranged in series, parallel, or hybrid configurations (Fig. 14). Series configuration distributes total SRE across multiple stages, typically starting with coarse bars at higher intensity for fiber opening, followed by fine bars at lower intensity for surface development. This design promotes gradual fiber treatment and better quality control but increases no-load power and control complexity. Parallel configuration splits the furnish across multiple refiners operating under identical conditions, offering capacity flexibility and redundancy but risking non-uniform treatment if synchronization is poor [4]. Hybrid systems combine both approaches, with primary refining in parallel for capacity and secondary refining in series for quality optimization [4,52].
4.4 Refining variables
4.4.1 Stock consistency and refining effects
Stock consistency is among the most influential variables governing low-consistency refining performance, as it controls the relative frequency of fiber–fiber versus fiber–bar interactions, as well as hydrodynamic loading in the refining zone [14,15,17,21]. In modern low-consistency systems, mills typically operate within 3.0–5.0% consistency, with narrower “best-practice” windows chosen by furnish type and property targets. For example, softwood pulps are commonly refined at 3.5–4.5%, hardwood pulps at 4.5–5.0%, and recycled fibers (e.g., OCC/ONP blends) at 3.5–4.5%, while a final homogenization or polishing stage may be run at 3.0–3.5% to smooth out local treatment heterogeneity before blending to the headbox [1,4,31,36].
At low consistency (typically below 3.0%), the suspension possesses a higher water-to-fiber ratio, which significantly reduces fiber–fiber friction and increases the frequency of direct fiber–bar impacts. This hydrodynamic state often shifts the refining mechanism toward fiber cutting rather than internal or external fibrillation. Furthermore, net energy efficiency is compromised as a greater volume of water must be accelerated through the plate grooves, leading to increased hydraulic losses and elevated no-load power requirements [1,4,14,17]. Flow maldistribution (“channeling”) may also occur when the fiber phase becomes too dilute to evenly occupy the refining gap [1,4,17,24,50,59,60,64]. Conversely, at optimal consistency (≈ 3.5–4.5%), the balance between fiber–fiber rubbing and fiber–bar brushing promotes efficient energy transfer into internal/external fibrillation with good controllability of freeness versus cutting; process stability is also improved because pressure pulsations and motor-load variability are minimized [4,36]. At high consistency (> 5.5%), excessive fiber–fiber friction and flocculation lower the probability of effective fiber–bar contact, yielding non-uniform treatment (some fibers over-refined, others under-refined), larger motor-load fluctuations, and increased risk of plate clashing and mechanical damage [21,22,33].
4.4.2 Effects of net refining energy
To maximize refining efficiency and optimize final paper properties, the distribution of energy input is as critical as the total amount applied. As illustrated in Fig. 15, comparing two methods of refining softwood kraft pulp—using high energy in fewer passes versus low energy in more frequent passes—reveals significant differences in pulp development [4,5,15,23]:
• Fiber integrity: Low-intensity refining over more stages preserves fiber length by avoiding harsh structural damage.
• Drainage and freeness: High-intensity refining causes a rapid drop in freeness because it cuts fibers, which quickly increases their specific surface area.
• Strength development: Applying energy in smaller, frequent “doses” promotes uniform fibrillation rather than destruction, leading to higher tensile strength and better bonding.
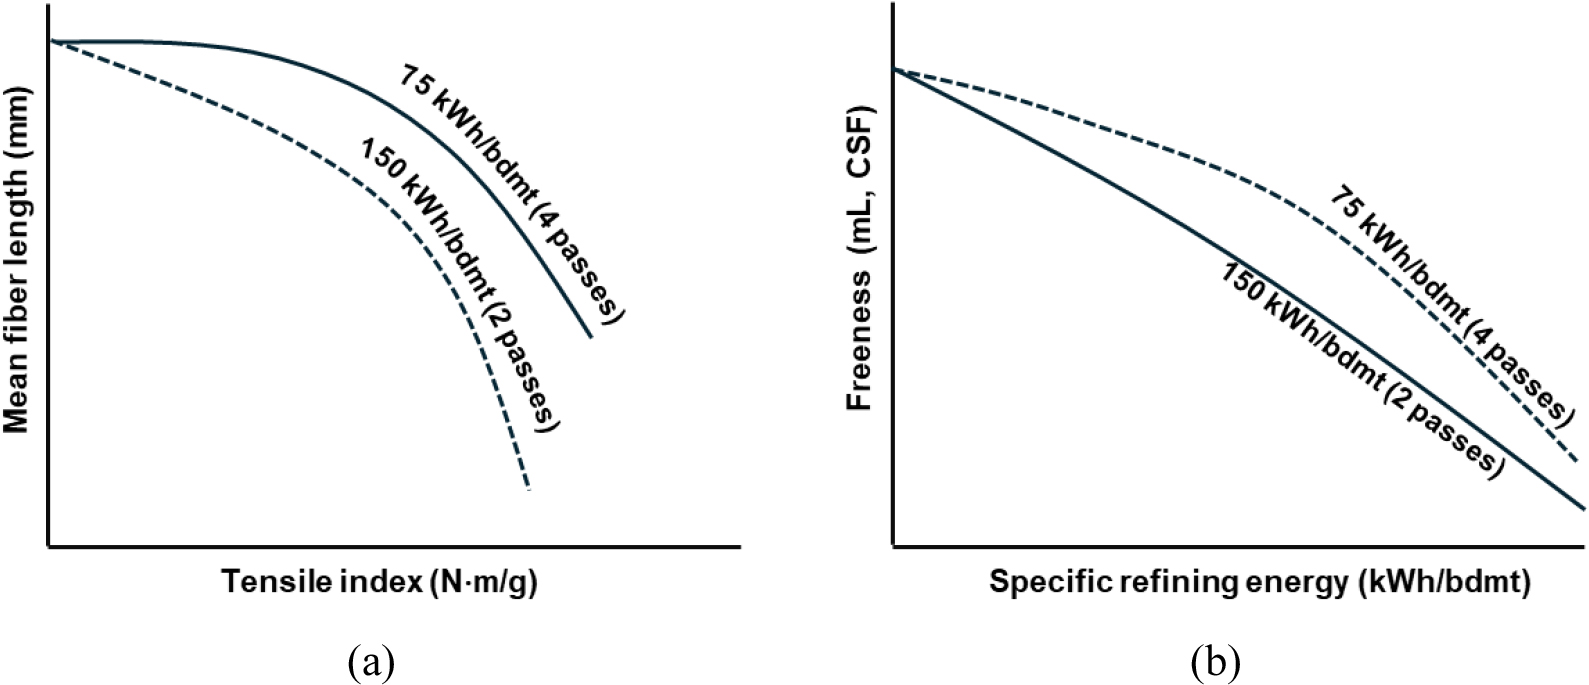
Fig. 15.
Effect of net refining energy distribution on (a) tensile strength vs. fiber length and (b) freeness [4].
In summary, a multi-stage approach with lower energy per pass protects fiber length while enhancing bonding, resulting in superior product quality and more efficient energy use.
Net refining energy (SRE) is the mechanical work delivered to fibers after subtracting no-load losses. Typical operating ranges span ≈ 25–200 kWh/bdmt, depending on fiber type, plate design, and property targets—lower for tissue/towel and higher for dense specialty grades [24,27]. Fig. 16 contrasts two energy-distribution strategies for softwood kraft: a single high-energy pass (150 kWh/bdmt) versus two lower-energy passes (75 kWh/bdmt each). In Fig. 16a, the high-energy single-pass produces a rapid drop in freeness through aggressive external fibrillation and cutting, whereas the multi-stage, low-intensity treatment yields a steadier decrease. In Fig. 16b, distributing energy across stages better preserves fiber length and promotes higher tensile strength at a given freeness, as uniform fibrillation and bonding development predominate over catastrophic cutting [4,34].
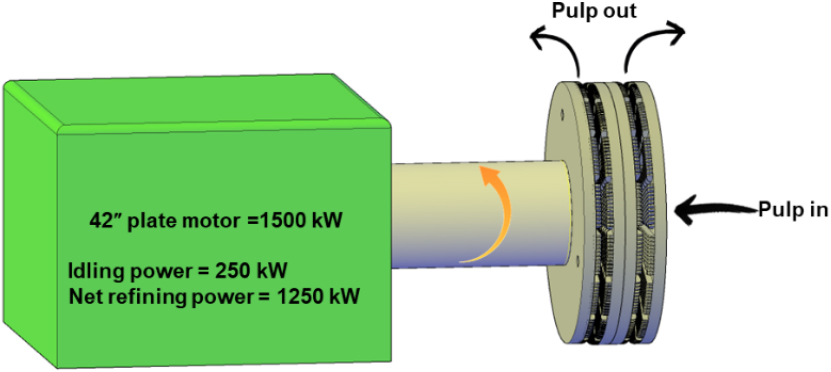
Across applications, typical SRE bands are: tissue/towel: 40–90 kWh/t; printing/writing: 60–120 kWh/t; packaging (kraft liner): 80–160 kWh/t; specialty (glassine): 120–220 kWh/t—reflecting the increasing demand for density, bond count, and surface consolidation along the sequence [4,30,52,53,55]. The refining efficiency (ratio of net power to total power) quantifies how much of the electrical input is actually used to modify fibers rather than to overcome mechanical/hydraulic losses. For a 1,500 kW refiner with 250 kW idling power,
as depicted in Fig. 16, indicating the majority of the power is transferred to the fiber phase under these conditions [3,12].
To assess how effectively energy reduces drainability, mills sometimes track a freeness-drop intensity metric,
with indicative values hardwood: 45–75, softwood: 15–30, recycled (OCC): 25–40 mL/(kW·day/t). While higher values signal rapid freeness reduction, they must be cross-checked against tensile/tear behavior to avoid excessive fiber damage and fines generation [3,7,12].
Operationally, SRE is best optimized incrementally (e.g., 10–15 kWh/t steps), establishing the target freeness first and then minimizing SRE to reach it while continuously monitoring the tear/tensile ratio. Because over-refining increases drainage resistance, mills also balance refining energy against dryer-section energy to minimize total site energy, not merely refiner power [2,4,6,7].
4.4.3 Stock pH and temperature
The chemical environment strongly influences fiber swelling, flexibility, and bonding potential; hence, pH and temperature are central levers in refining efficiency [1,3,4,13]. As summarized in Fig. 17, which illustrates the typical dependence of freeness and tensile strength on stock pH, operation in a neutral to slightly alkaline range (pH 7–8) generally maximizes swelling and conformability while maintaining stable conditions and favorable property development per unit energy. Acidic conditions (pH < 6) reduce swelling and require 10–15% more energy to achieve similar freeness/strength levels, while also increasing the risk of plate corrosion and pulp yellowing. Highly alkaline states (pH > 9) can over-swell fibers, impair drainage, and—in some cases—promote chemical weakening through hydrolysis, increasing chemical cost without commensurate property gains [1,3,4,13].
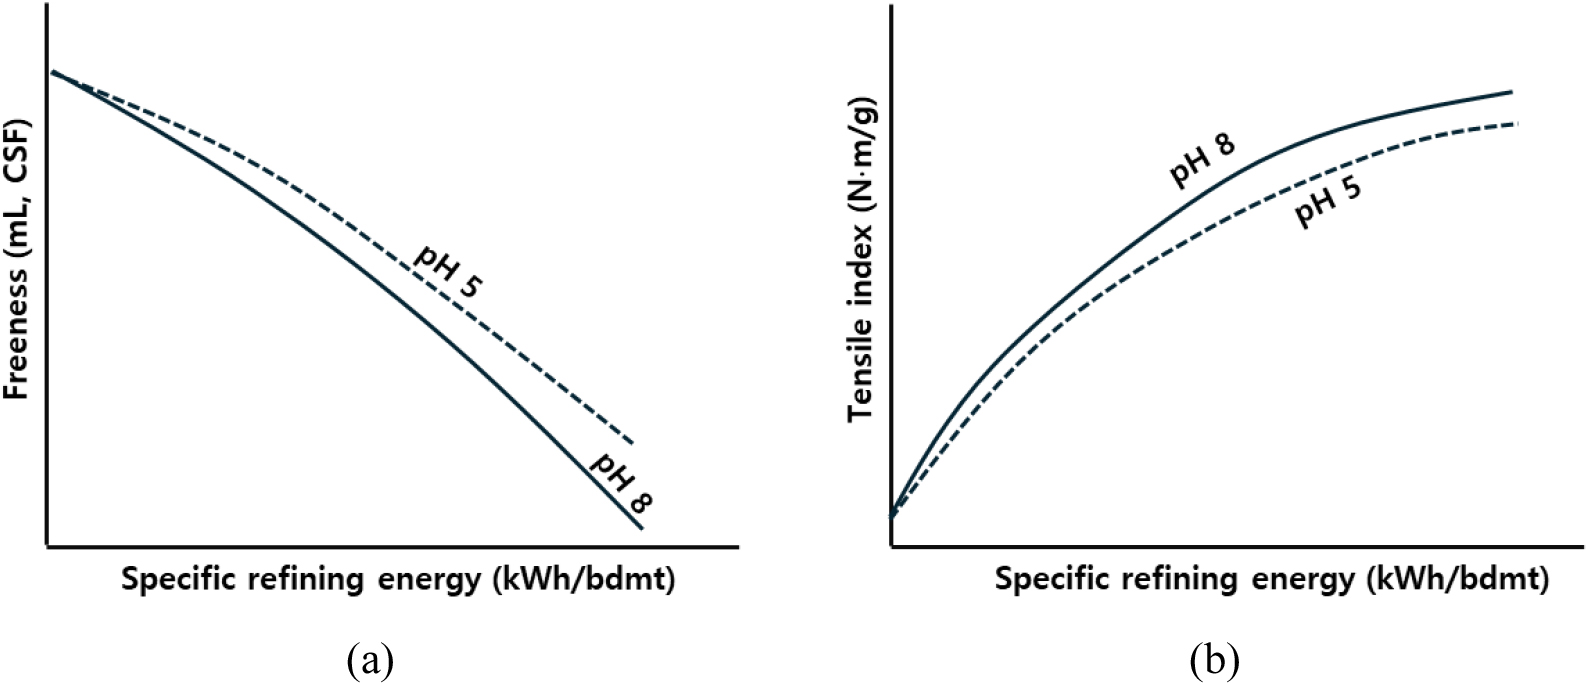
Fig. 17.
Effect of refining and stock pH on pulp properties: (a) Relationship between stock pH and freeness, and (b) Relationship between stock pH and tensile strength [4].
From a control standpoint, mills commonly adjust pH with NaOH or Na2CO3, targeting approximately pH 7.5 for chemical pulps, and monitor the process continuously to compensate for water-source variability and recycled-fiber content [3,4,7]. Temperature presents a similar optimization: approximately 40–50°C often offers the best compromise between viscosity and fiber flexibility. Below around 30°C, viscosity increases and treatment tends to be harsher (more cutting), while above 60°C, there are risks of fiber weakening, thermal degradation, accelerated plate wear, and safety concerns from incipient steam generation. Most mills operate at 35–45°C due to mechanical heating of the stock, adding steam in winter as needed, and utilizing plate cooling for high-intensity operations [3,4,7,13].
4.4.4 Stock throughput management
Stock throughput (fiber flow rate) determines residence time in the refining zone and the effective thickness of the fiber mat between the plates, thereby controlling hydrodynamic stability (Fig. 18). Plate geometry, specifically groove width and depth, directly influences the hydraulic capacity and flow velocity within the refining zone. Shallower or narrower grooves can increase flow resistance, thereby affecting the pressure differential and the structural uniformity of the fiber mat [6]. At low throughput—below approximately 70% of design capacity—the fiber population is insufficient to maintain a continuous mat (Fig. 18a). This promotes channeling, pressure fluctuations (often 25–50 psi), unstable motor loads, and an increased likelihood of plate contact due to inadequate fiber cushioning [7,10,11,24,64].
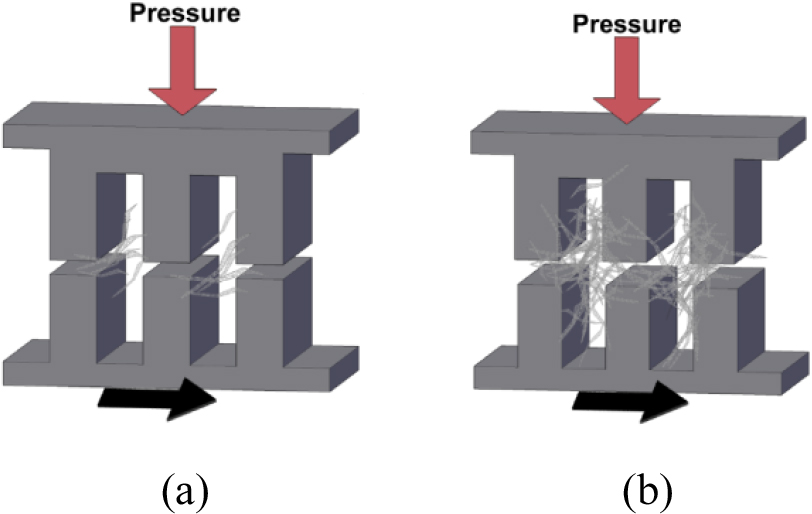
At high throughput—at or above design capacity—the system develops an overly dense mat (Fig. 18b), increasing hydraulic resistance and pressure drop. Residence time becomes inadequate for proper fiber development, leading to under-refining and faster plate wear resulting from high drag forces.
Optimal operating conditions are typically achieved at ~85% of design capacity, where mat uniformity and power stability are highest. The use of variable frequency drives (VFDs) is recommended to maintain this balance during production changes. Operators should monitor specific energy (kWh/t) rather than total power, since variations in fiber density can mask the true refining intensity. When production rates vary by more than ~15%, plate gaps should be readjusted to compensate for changes in mat thickness and maintain consistent pulp quality [39,40,42,60,61,62,63,64].
4.4.5 Influence of pulp types and fiber coarseness
Fiber coarseness—expressed as mass per unit length (mg/100 m)—is a fundamental determinant of refining requirements because it reflects cell wall thickness and rigidity [1,3,4,12,37,64]. As illustrated in Figs. 19a and 20, high-coarseness fibers (> 20 mg/100 m), typical of unbleached softwood kraft, exhibit thick walls and stiff morphology [1]. These fibers demand high-intensity refining (SEL ≈ 1.5–2.0 W·s/m) using coarse bar patterns (3–5 mm) to induce internal fibrillation and flexibility, with SRE often in the range of 80–160 kWh/t. Medium-coarseness fibers (10–20 mg/100 m), such as bleached softwood and certain hardwoods, require moderate intensity (SEL ≈ 0.8–1.5 W·s/m) and medium bar patterns (2–3 mm), balancing internal and external fibrillation at SRE levels of 50–100 kWh/t [3,4,64].
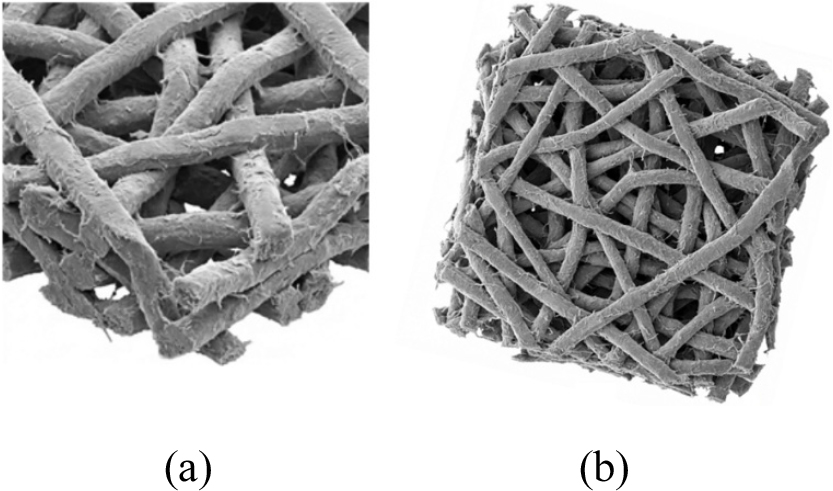
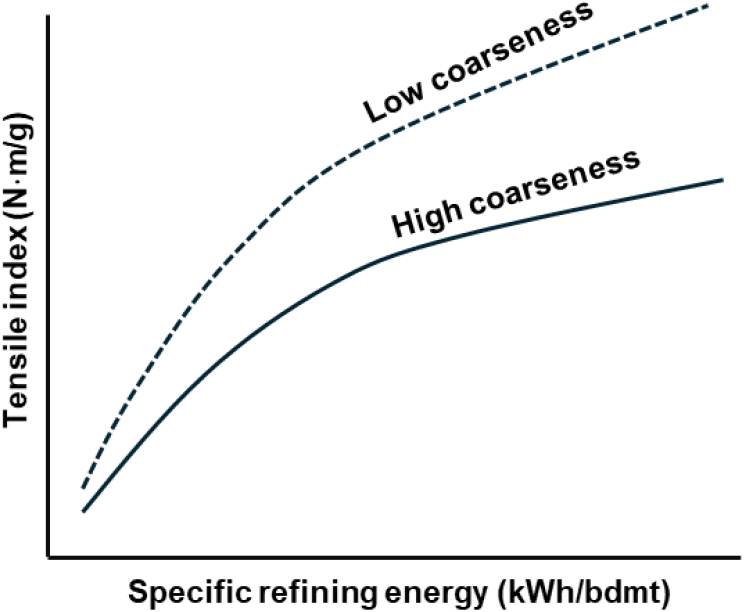
As depicted in Figs. 19b and 20, low-coarseness fibers (< 10 mg/100 m), including hardwood kraft and recycled fibers, are inherently flexible and thus respond best to low-intensity refining (SEL ≈ 0.4–0.8 W·s/m) with fine bar patterns (1–2 mm). Here, the primary objective is surface development through external fibrillation, typically at 40–80 kWh/t; however, over-refining can lead to excessive fiber shortening and loss of tear strength [7,10,11,24,64].
For mixed furnishes, a segregated strategy is recommended: refine high-coarseness components separately at high intensity and low-coarseness components at low intensity, then blend to achieve optimal sheet properties.
4.4.6 Plate bar crossing angle
The crossing angle between rotor and stator bars strongly influences the mechanical action imparted to fibers, dictating whether cutting or fibrillation predominates [4,16,19]. As shown in Fig. 21a, small angles (10–20°) generate higher normal impact forces and more cutting at bar edges, making them suitable for primary softwood refining where fiber length reduction is desired—though excessive cutting can compromise tear strength [4,36].
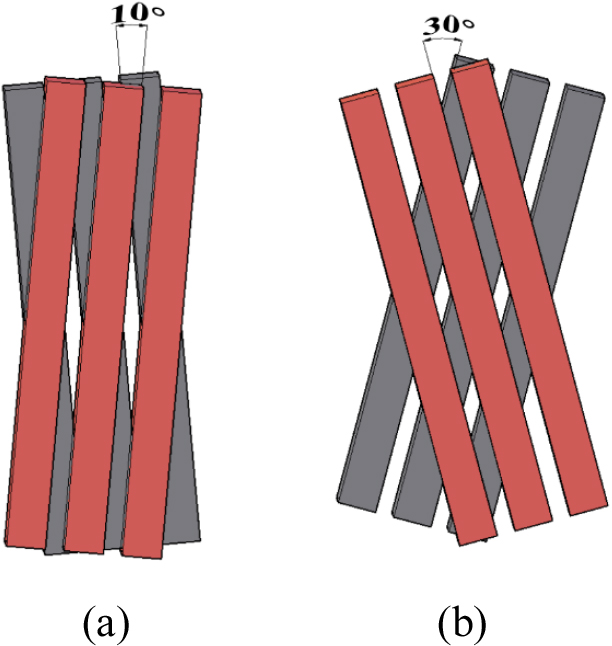
As displayed in Fig. 21b, medium angles (20–30°) provide a balanced mix of cutting and brushing, making them common for mixed furnishes and secondary refining stages. Large angles (30–40°) favor tangential brushing forces that promote external fibrillation with minimal cutting, ideal for hardwood and recycled fiber treatment, where surface development and bonding are prioritized [4,12,24].
Angles beyond 40° are rarely used, except for delicate fibers that require ultra-gentle treatment, often necessitating multiple passes to achieve the target freeness. Because the crossing angle is fixed by plate design, mills must select plates based on the dominant fiber type, target properties, and anticipated grade flexibility.
5. Integrated Advances and Grade-Specific Strategies
Modern refining has transitioned to a data-driven process in which digitalization and sustainability are central to quality control. Advanced sensors and Supervisory Control and Data Acquisition (SCADA) systems now provide real-time monitoring of consistency (±0.05%), flow, and fiber morphology, while acoustic and vibration sensors prevent catastrophic plate clashing [1,4,39,40,41,42,43,44,61,63]. These technologies enable the use of Digital Twins to optimize setpoints for SEL and plate gaps, often yielding energy savings of 5–10 kWh/t [41,60,61,62,63,64].
Sustainability efforts focus on reducing “no-load” energy through VFD-based speed control—potentially lowering idle power by 35%—and on adopting ultra-fine plate patterns (1–1.5 mm) that promote fibrillation rather than fiber cutting [56,59,60,61,62,63,64]. Such strategies, combined with multi-stage refining and Life Cycle Assessment (LCA), ensure that energy use is balanced against downstream drainage and carbon targets [44,45].
Ultimately, refining strategies are strictly dictated by final product requirements and are highly grade-specific. For printing and writing grades, low-intensity hardwood refining is utilized to prioritize surface smoothness and tensile development [4,16,23,24,26,64]. In contrast, packaging grades typically require higher-intensity softwood treatment to maximize burst strength and structural integrity. The processing for tissue and specialty papers represents two extremes: tissue production employs minimal refining to preserve essential bulk and absorbency, while specialty grades, such as glassine, necessitate intensive multi-stage processing to achieve the required high density and low freeness [52,53,54,57].
Effective operation relies on Statistical Process Control (SPC) to detect drift early, allowing for timely troubleshooting of strength or drainage issues through precise gap and pH adjustments [39,59,64].
Modern refining systems have evolved from manually adjusted mechanical processes into highly digitalized operations capable of real-time data analysis and autonomous optimization. According to recent studies [1,3,4,7,13,59,60,61,62,63], integrating sophisticated sensor networks enables precise monitoring of inlet and outlet parameters. At the inlet, sensors maintain stock consistency within an accuracy of ±0.05%, while also tracking temperature, pH, flow rate, and differential pressure. At the outlet, inline freeness testers and optical sensors evaluate fiber length distribution and fines content with high precision, providing immediate feedback on the refining progress. Furthermore, equipment health is continuously monitored through vibration analysis and acoustic signatures, which are essential for detecting plate clashing and preventing bearing failures [38,39,40,41,42,43,59,60,61,62].
The core of modern digitalization lies in integrated control loops. The Quality Control Loop primarily manages the plate gap to maintain target freeness, utilizing hydraulic positioning systems with a precision of ±10 µm. Simultaneously, the Energy Optimization Loop monitors the SEL in real time to minimize SRE while ensuring quality targets are met. To ensure operational longevity, the Equipment Protection Loop provides automated responses to excessive vibration or power surges, such as increasing gaps or system shutdowns. These loops are integrated into SCADA systems that provide centralized monitoring, historical trending, and advanced analytics, including SPC, to maintain property stability [57,58,59].
Beyond basic control, Digital Twin technology represents the frontier of refining optimization. By creating a physics-based virtual replica of the refining process, mills can perform “what-if” scenarios and predictive quality control without interrupting actual production. These models can predict freeness trends ten minutes in advance and suggest optimal setpoints for consistency, gap, and SEL to achieve specific target properties, typically resulting in energy savings of 5–10 kWh/t and significant reductions in quality variance [34,35,63].
6. Conclusions and Future Directions
This two-part series has shown that the energy–quality paradox in pulp refining can be effectively managed through quantitative theory, advanced plate technology, and intelligent control. Part II demonstrated how SEL and SSL provide practical tools for predicting and managing refining intensity, enabling more consistent and energy-efficient fiber development. Low- and ultra-low-intensity refining with fine bar patterns (0.8–1.2 mm) emerged as a highly effective strategy, achieving meaningful gains in tensile and burst strength, improved formation, and significantly reduced energy use and plate wear. These improvements represent a substantial potential for economic benefit in large-scale mill operations by reducing specific energy consumption and extending the service life of refining components. Critical operational windows for consistency, pH, temperature, and bar-crossing angle, along with appropriate system configuration, must be maintained to fully realize these benefits. Digitalization—via real-time sensing, automated feedback, and predictive analytics—further enhances refining stability and enables adaptive, data-driven optimization. Grade-specific refining strategies reinforce that no universal settings exist; intensity targets must be tailored to product requirements, including stratified approaches for multi-ply boards.
Overall, the combined advances in theory, plate design, and smart control provide a clear path toward refining systems that simultaneously improve product quality, reduce energy demand, and strengthen the sustainability of modern papermaking.
